Matthew A. O'Brien, M.A., RPA 4409010
ORCID: 0000-0001-5653-8940
License: Creative Commons 4.0 Attribution (CC-BY)
Full Report (Google Drive)
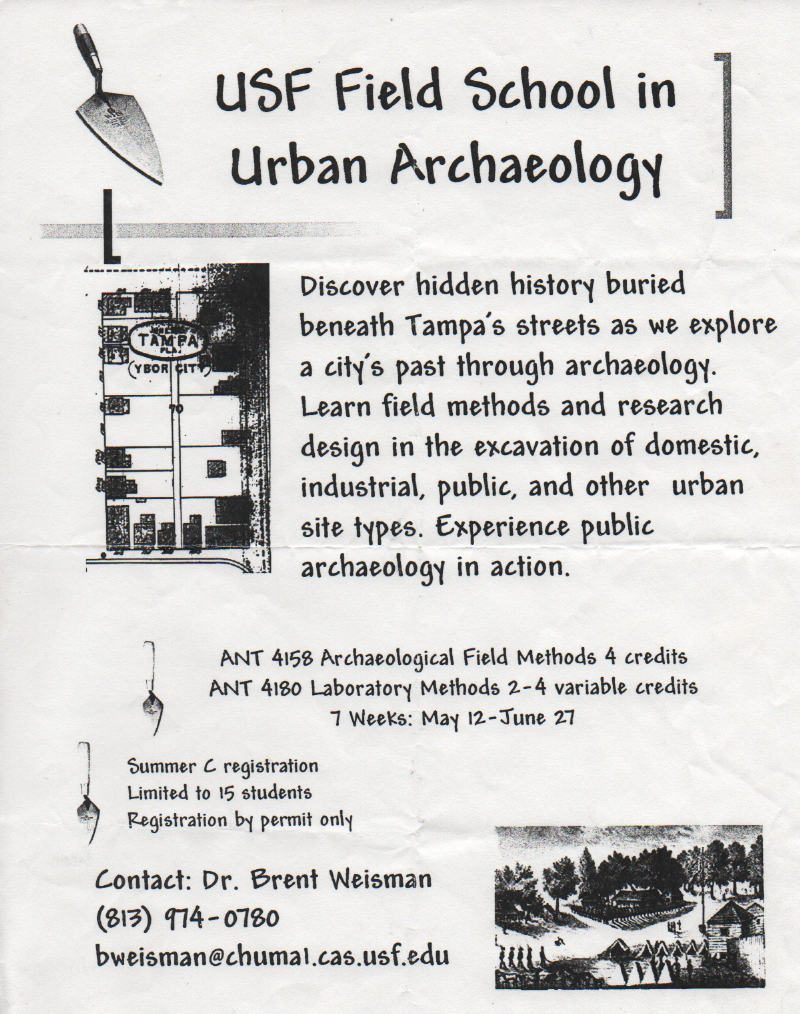
Flyer for 2003 USF Field School
During the summer of 2003, the University of South Florida's (USF) Department of Anthropology conducted a field school in urban archaeology, in Tampa, Florida. The field school was subsidized with grant funding from the Florida Department of Transportation (FDOT), with the expectation that the research would ultimately produce a proposed model for evaluating the archaeological potential of urban locations. As an outgrowth of this research, a 100-foot by 100-foot section of Perry Harvey Sr. Park was targeted for assessment through the use of manual, scissor-style posthole diggers as subsurface sampling instruments. The resulting analysis was both included in the final report delivered to FDOT (#BC353-49), and used as the basis for the author's senior honors thesis. While the fieldwork was conducted almost two decades ago, the results may still be useful; to this end, the data have been reinterpreted with the improved spatial analysis and representation capabilities of a geographic information system (GIS).SEE IT ON GOOGLE EARTH
The posthole analysis project was sited in the interior of a mixed-use (commercial and residential), urban block; on the 1903 Sanborn fire insurance map, for Tampa, this area was designated Block 120. Historically, this portion of Perry Harvey Sr. Park was bounded on the west by the commercial establishments along the east side of Central Avenue, on the north by Long Emery Street, on the south by East Harrison Street, and on the east by Gladstone Alley. To maintain separation from the activities of the USF field school, the materials recovered through posthole sampling were cataloged, analyzed, and interpreted as the Gladstone Alley Project. The primary purpose of the Gladstone Alley project was to evaluate the overall utility of using manual, scissor-style posthole diggers as subsurface sampling instruments, for conducting rapid assessments of archaeological productivity in urban settings.
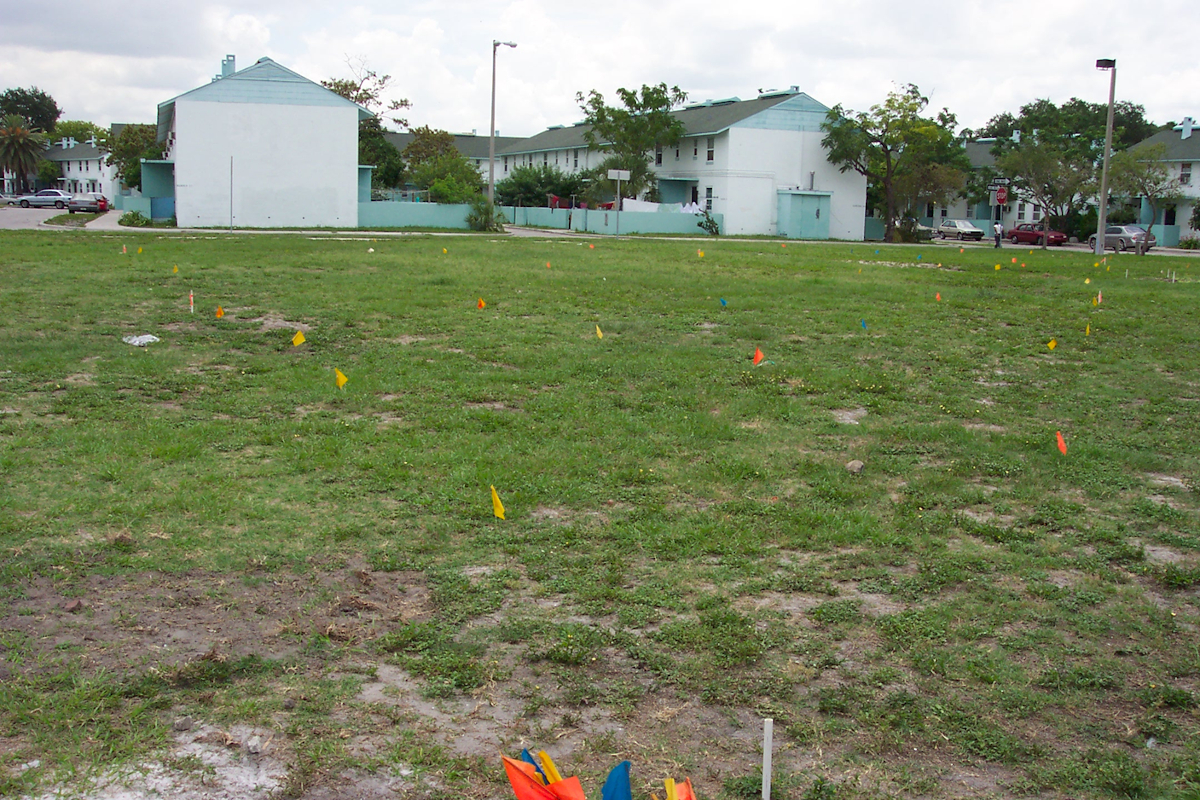
Gladstone Alley project area,
facing east
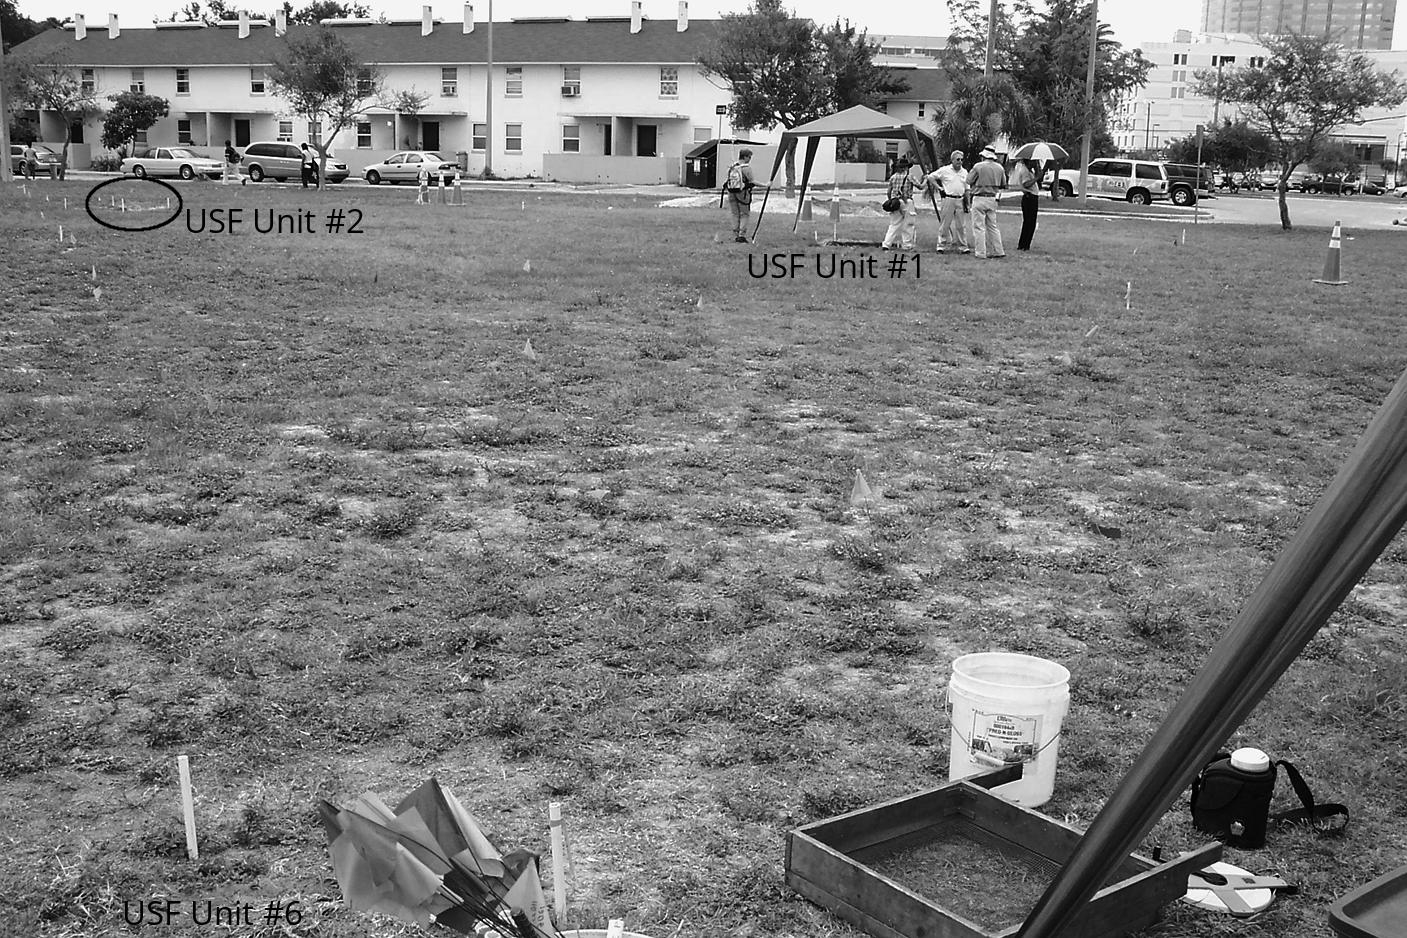
Gladstone Alley project area,
facing southeast
The director of the USF field school, Dr. Brent R. Weisman, specified that the project grid should be laid out to include the open areas behind both the residences along the west side of Gladstone Alley, and the commercial buildings along the east side of Central Avenue. Furthermore, half the posthole samples were to be placed at an interval of 10 feet, and the other half were to be placed at an interval of 20 feet. The principal research questions to be addressed were: Can a meaningful, representative sample, from a known urban archaeological site, be obtained through the use of manual scissor-style posthole diggers? Does changing the sampling interval, from 10-feet to 20-feet, substantially affect the resulting interpretation? The secondary research questions, used to evaluate the responses to the primary research questions, were: Do the data resulting from posthole-sized subsurface samples reveal the full temporal range of historical site usage, as indicated by previous archival and archaeological research? Do posthole-sized subsurface samples support the identification of discrete activity areas within the site? Finally, the author's literature review, prior to starting the fieldwork, prompted him to include as a tertiary research question: Do the excavation units provide sufficient volumetric consistency, and archaeological productivity, to support statistical analysis?
Physical Setting
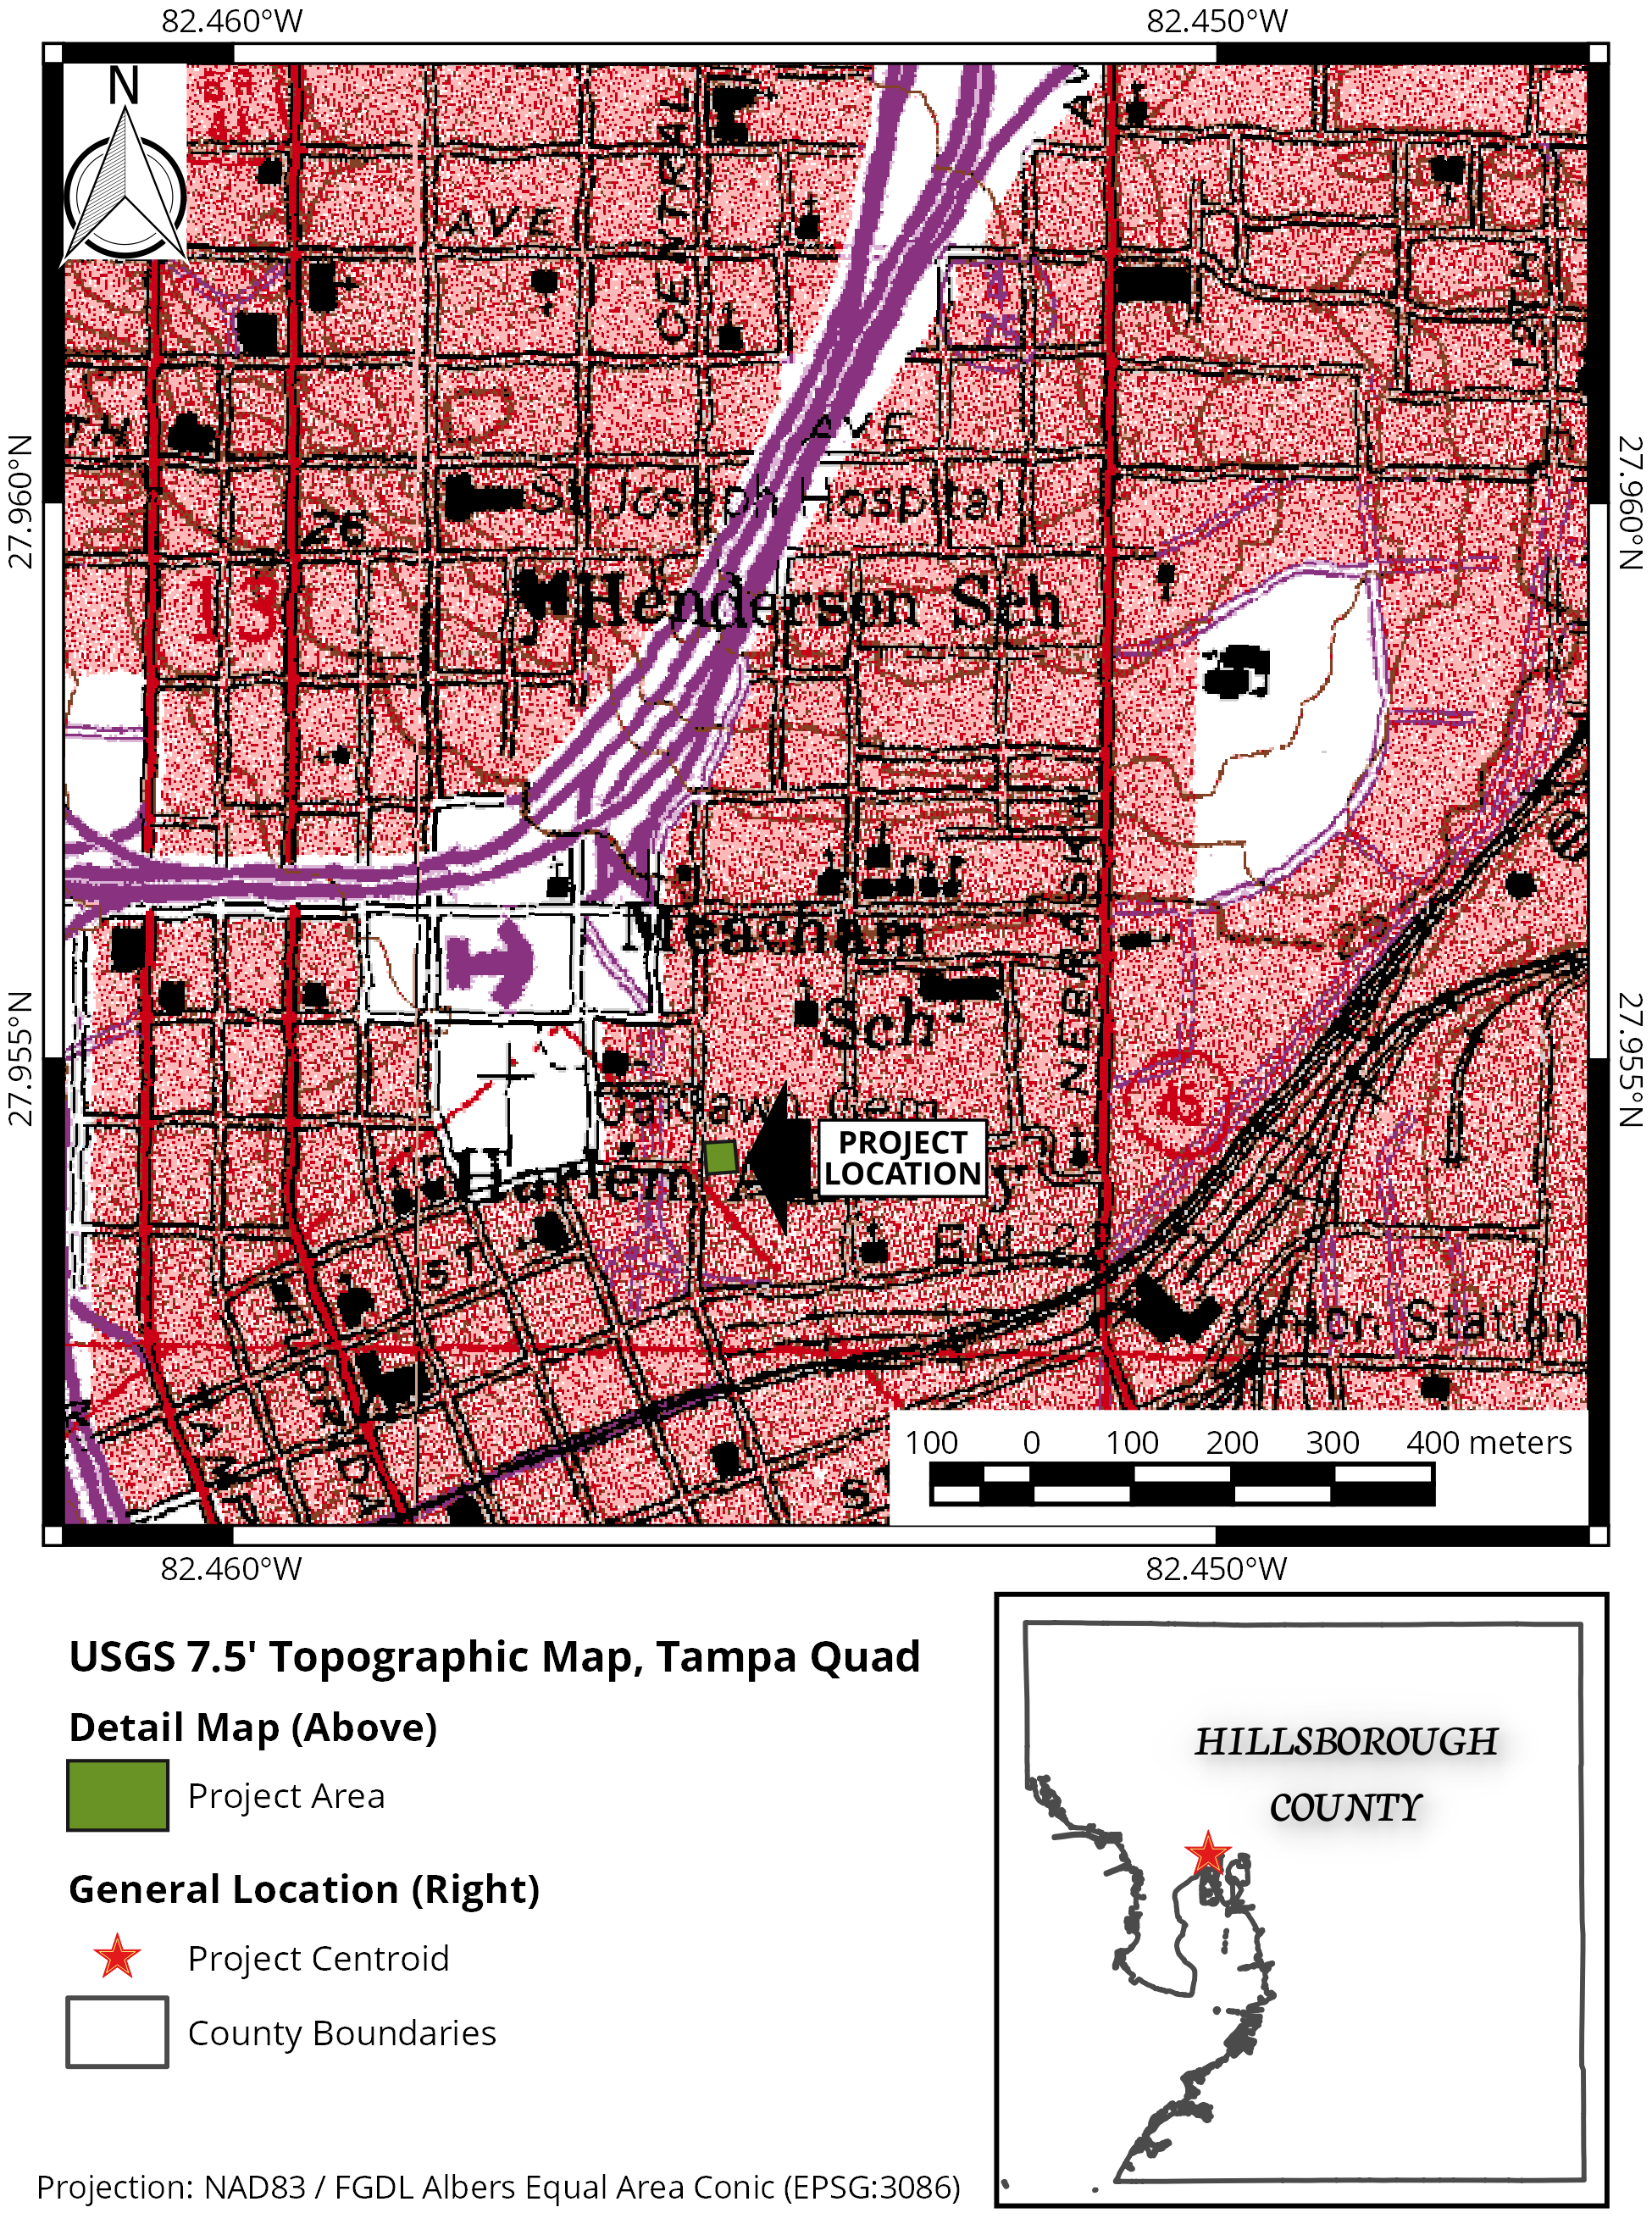
Project Location Map
Perry Harvey, Sr. Park is located northeast of the Central Business District (CBD) in Tampa, Florida. The project location is in the SW1/4 of the SE1/4 of the SE1/4, Section 13, Township 29 South, Range 18 East. As reckoned from the North American Datum of 1983 (NAD83), the project area's centroid is located at approximately 82.455 degrees West, and 27.954 degrees North. The park's terrain, in the project area, is level, and surface vegetation is limited to closely cut grasses and common weeds. The elevation of the project is area is about 7 meters (23 ft.) above sea level, as reckoned from the North American Vertical Datum of 1988 (NAVD88).
The park is bounded on the north by Kay Street, and on the west by Orange Avenue. To the south, the park extends to Tyler Street, except where a segment of Orange Avenue curves eastward to intersect with Tyler. In 2003, the park was bounded to the east by the public housing units of Central Park Village; these housing units were subsequently replaced by residential highrises. A low, tree-lined berm separates the western edge of the park grounds from Orange Avenue. During the time period when the project was conducted, the park's amenities included a small pavilion, two concrete-surfaced tennis courts, and a skateboarding area. The park was refurbished, in early 2016; the redesign explicitly called for honoring the history of the Central Avenue business district, and the African American heritage of the surrounding neighborhood(s).
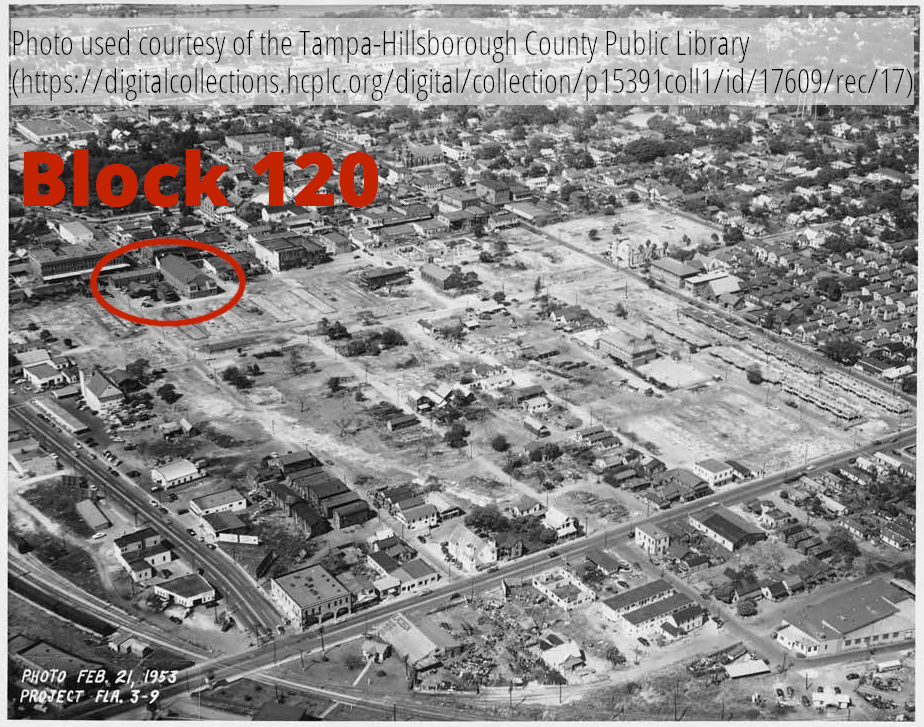
The project area is roughly 920 meters (0.57 mi.) east of the Hillsborough River, 1.5 kilometers (0.93 mi.) north of the Garrison Channel in Hillsborough Bay, and 1.1 kilometers (0.68 mi.) west of the Ybor Channel. Interstate 275 is approximately 250 meters (820 ft.) to the north, and the nearest segment of the Crosstown Expressway's route is about 500 meters (0.31 mi.) east-southeast of the project area. There are railroad tracks, trending east-northeast to west-southwest, roughly 225 meters (722 ft.) south of the project area. The National Register of Historic Places-listed Union Railroad Station lies about 420 meters (0.26 mi.) east-southeast, and Tampa's earliest cemetery, Oak Lawn, lies about 130 meters (426.5 ft.) due west; these two cultural features will be discussed in greater detail later. From around 1944, until 1974, the northern half of the project area was covered by the Lincoln Theater.
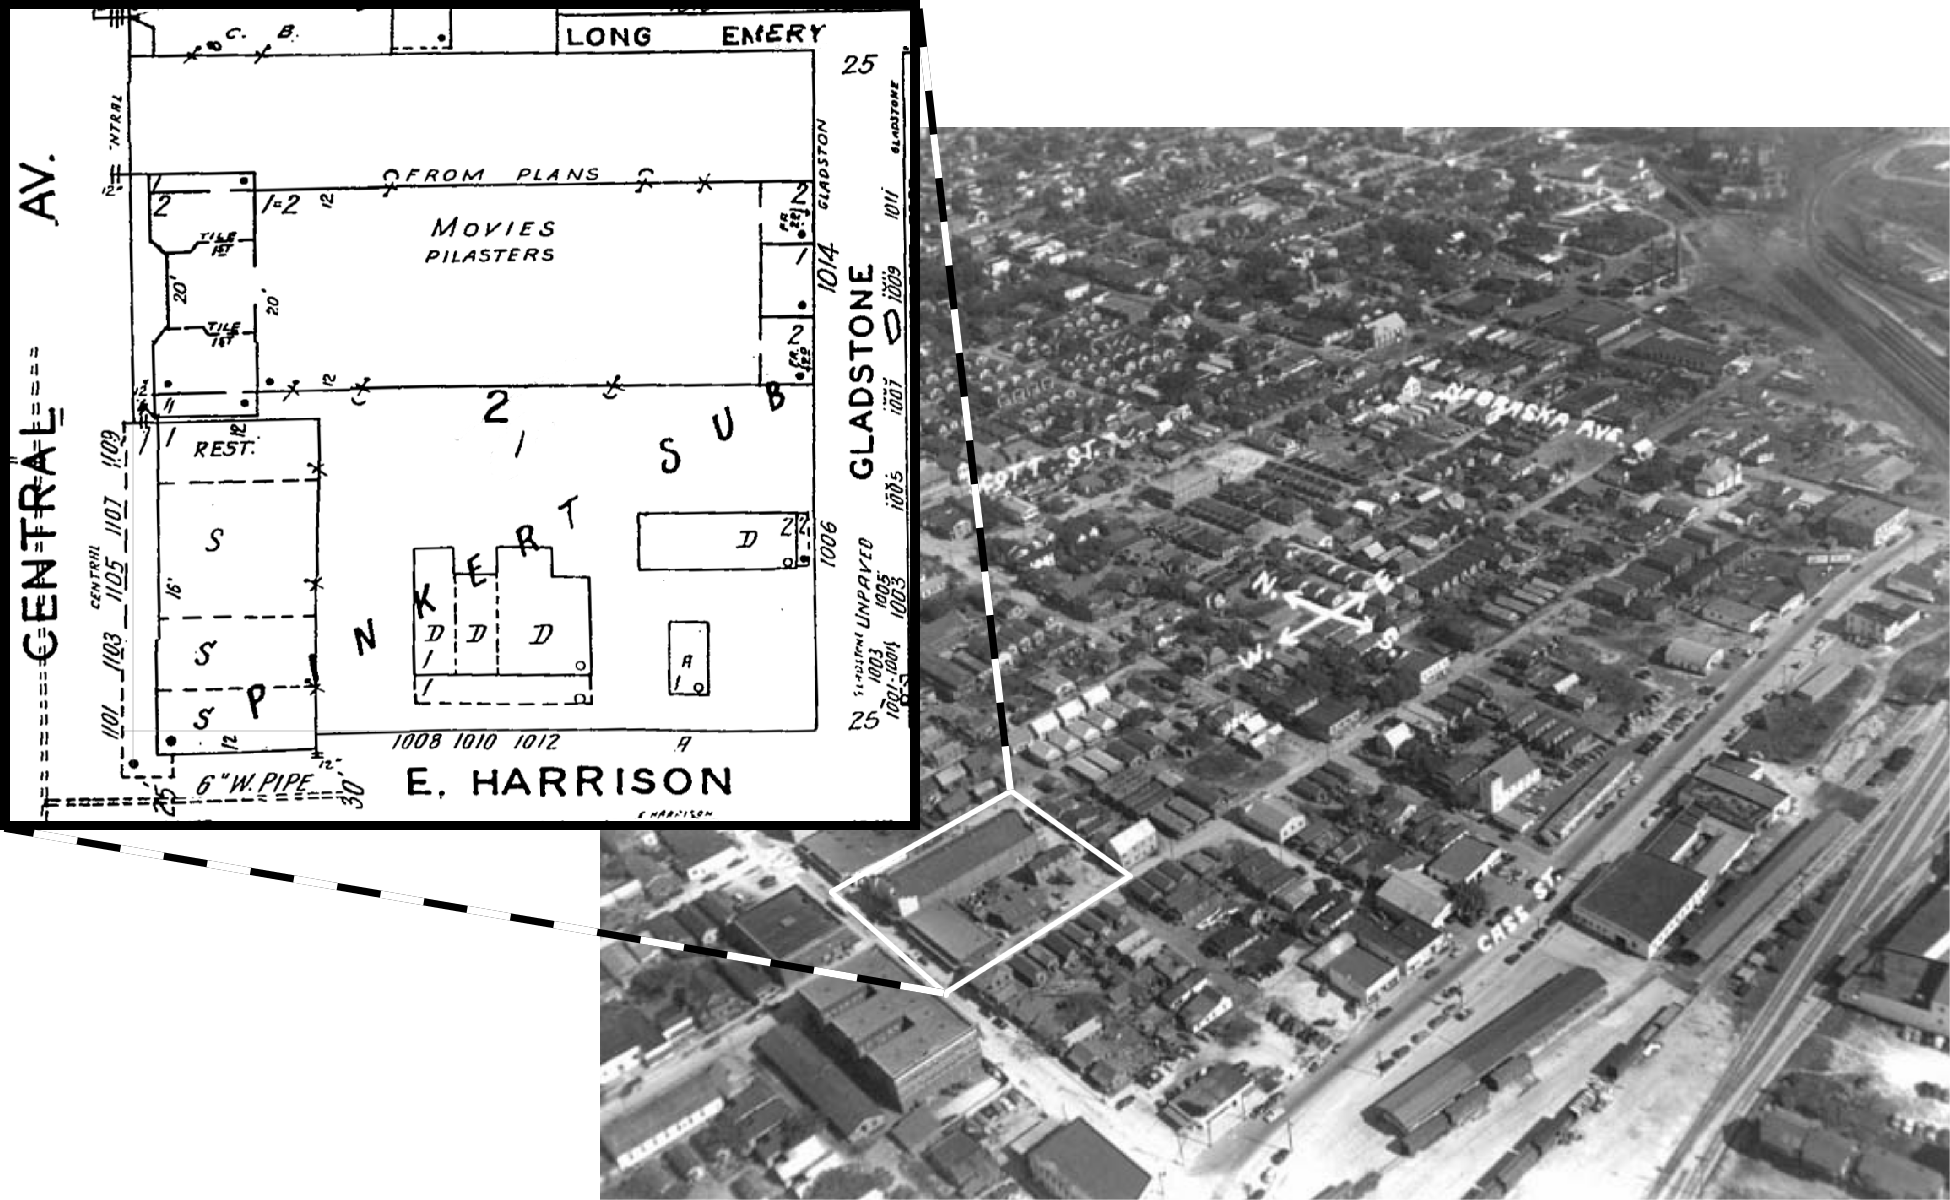
Gladstone Alley project area ca.1951, with the Lincoln Theater shown
Aerial photo used courtesy of the Tampa-Hillsborough County Public Library.
The land in the general vicinity of the project was in use as a residential area for African Americans, through most (or all) of the latter half of the nineteenth century. The location selected for intensive subsurface study was situated to examine a residential area immediately behind commercial buildings lining the east side of Central Avenue. Most of the private residences in the “Scrub” neighborhood were removed in the early 1950s (see more photographs of the "Scrub," in the Burgert Brothers collection, at the Tampa-Hillsborough County Public Library) although some commercial buildings remained until, at least, the late 1960s. Work on the Jefferson Avenue approach to Interstate 275, in 1968, changed traffic patterns in the area; and, the segment of Central Avenue adjacent to the study area was completely removed by 1974. Perry Harvey, Sr. Park was opened to the public in 1979.
For additional details on the Physical Setting:
Physical Setting Chapter with Bibliography
Cultural History
The original town of Tampa grew up around the military Fort Brooke; the fort was constructed in 1824. The fort itself is often remembered as the point of origin for Major Dade, who’s ill fated expedition to Fort King touched off the Second Seminole War on December 28, 1835; by the end of the war, the fort would also serve as a temporary interment facility for Indians awaiting transport to Indian Territory in what is now Oklahoma. By the end of the 1830s, several lots, including three on Tampa Street near Whiting, had been sold to private citizens, and the stage was set for a burgeoning civilian population. The town of Tampa was finally incorporated in 1855, only 10 years after Florida was established as a state. Tampa’s growth progressed slowly through the next 30 years; it was hampered by an outbreak of Yellow Fever in 1858 that reduced the town’s population by one quarter, and by the decommissioning of Fort Brooke in 1859, though some troops remained stationed there until 1882.
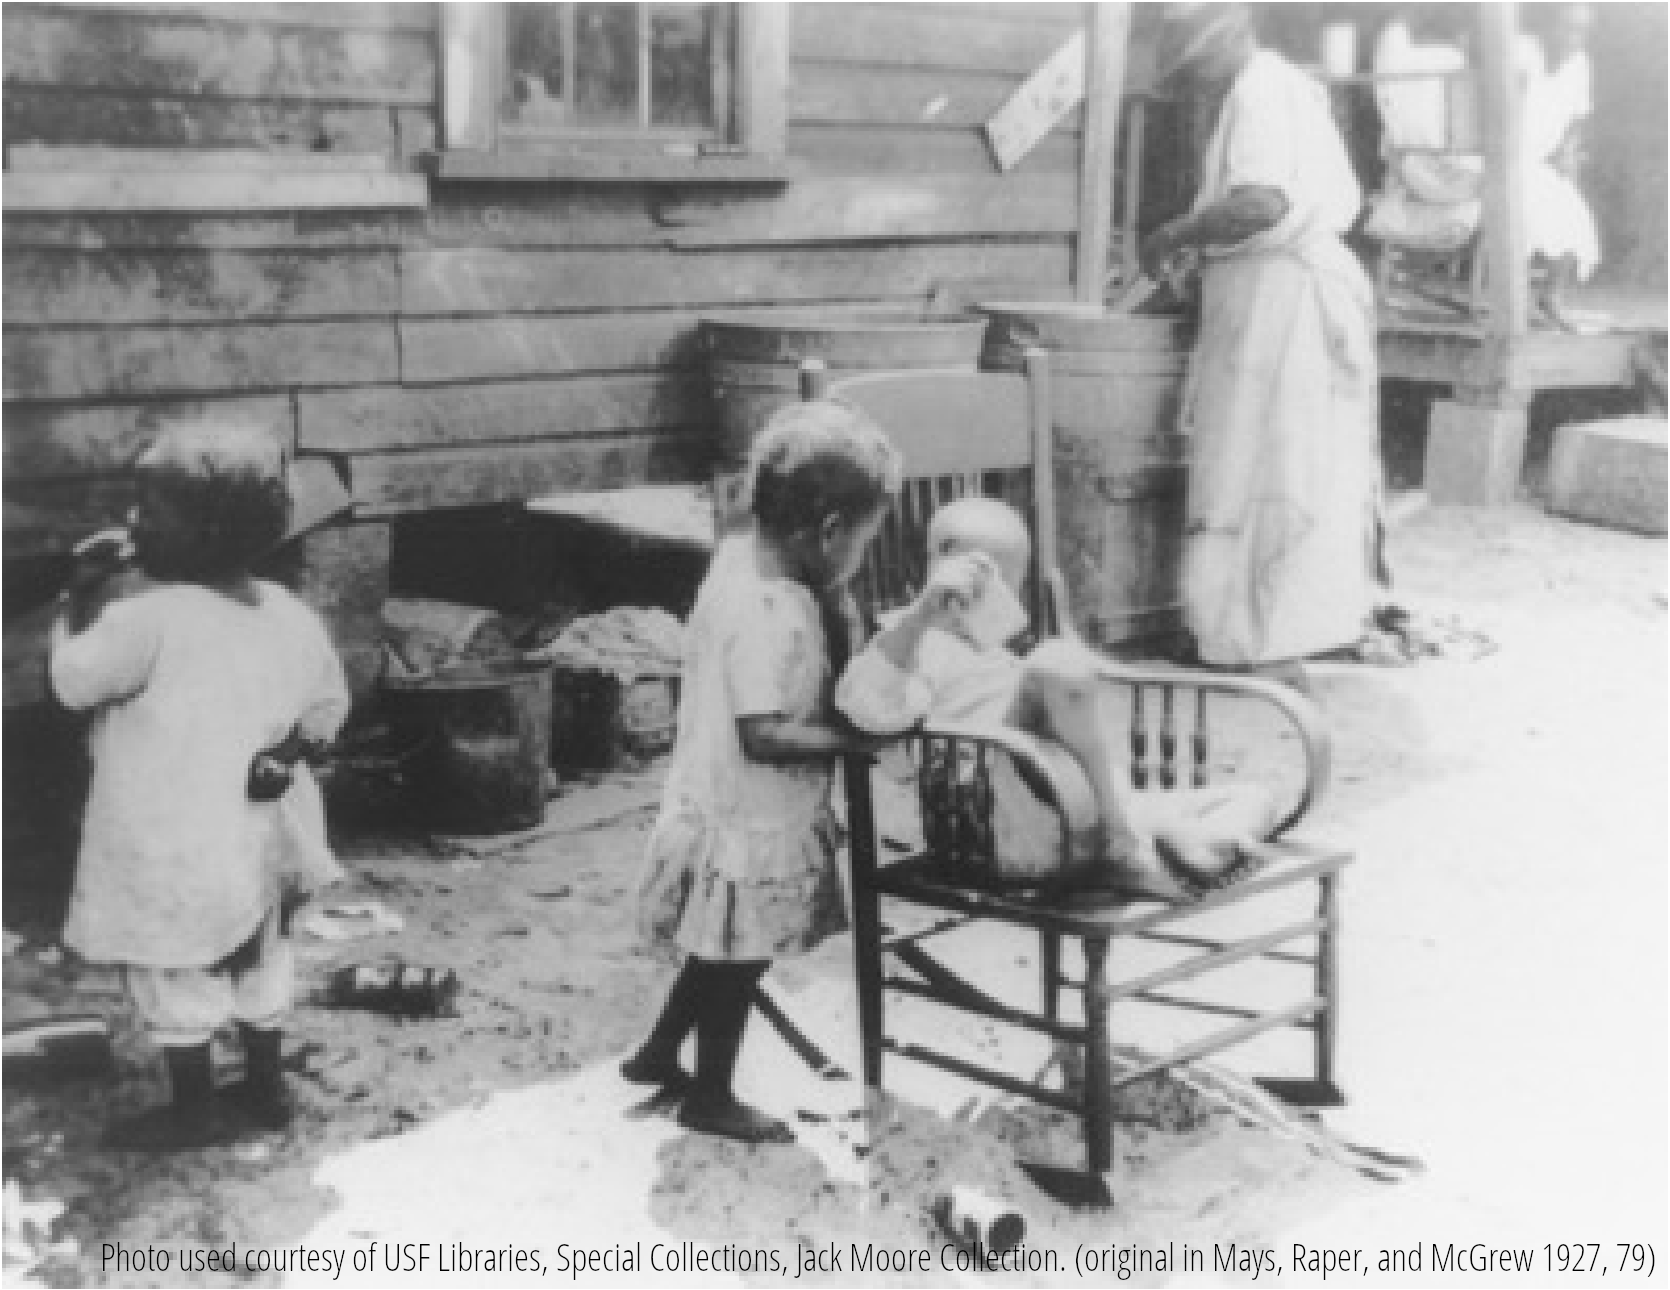
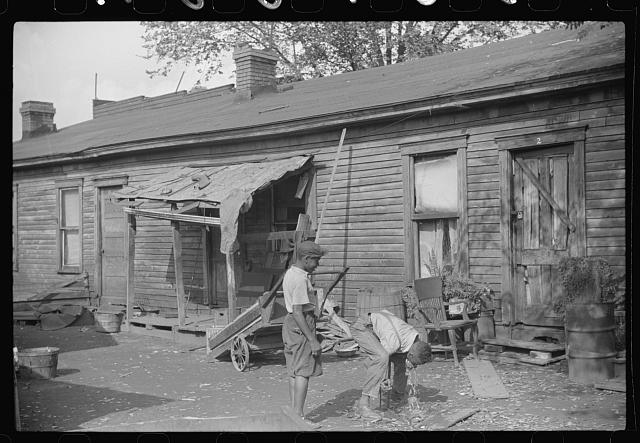
Laundry was often done outdoors,
in metal tubs.
The 1880 census records that Tampa’s population was 720 people; only 5 years later, after Vicente Martinez Ybor agreed to move his cigar manufacturing industry to Tampa, the population trebled to almost 2,500. One traveler described the unpainted houses and dirt roads of Tampa; she called particular attention to several dominant features of the town, including two saloons and two lumber mills. It was in the vicinity of one of those lumber mills that one of the Tampa areas earliest recognized neighborhoods, the African American enclave known as "the Scrub," sprang to life; this neighborhood, “bounded by Scott [Street] on the north, Cass [Street] on the south, Central Avenue on the west, and Nebraska [Avenue] on the east” housed the highest “concentration” of blacks in the Tampa area, and was described as ‘impenetrable and serv[ing] to remind one of a walled city.'
|
WV Connections |
 Doing laundry outdoors in metal tubs was common in West Virginia, too. 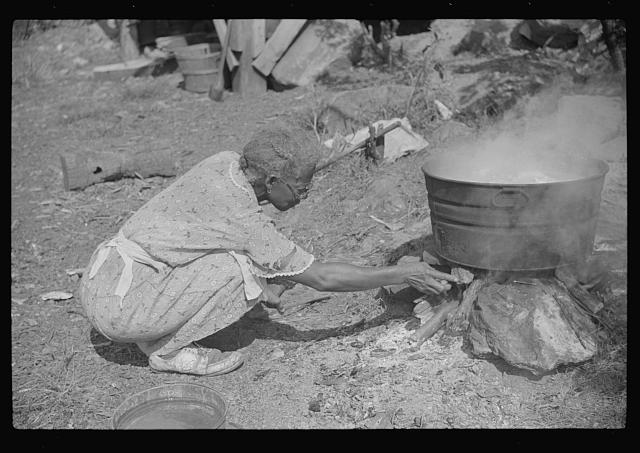 Supporting the metal tub over the fire on large rocks was common in Tampa, also. |
The neighborhood is also mentioned during an outbreak of Yellow Fever in 1887, when “the Scrub” and Ybor City were brought under the supervision of the local board of health’s inspections." The household organization of this period tended towards inclusion of the extended family, and perhaps boarders as well; in 1880, about half of Tampa’s 178 African American run households were “male-headed nuclear families." In about 64 percent of those 178 households, a male was the sole money earner of the house; however, the 1880 census did list, for the first time in Tampa, the profession of laundress. However, there had certainly been laundresses plying their trade in the area for quite some time; shortly after emancipation a woman named Dorcas Bryant had “homesteaded a 60 acre tract” here, and she supported herself by taking in laundry.
From the 1940s to the 1970s, Tampa aggressively pursued expansion, and various urban renewal projects; however, going back to the 1930s “the Scrub” neighborhood was targeted for clearance. The city annexed a significant portion of the suburbs surrounding old Tampa in 1953, and began acting on a 1952 ruling in the state legislation that allowed the city to pursue urban renewal projects. Many of Tampa’s impoverished neighborhoods were targeted for demolition; moreover, private housing, rather than public housing, was expected to cover almost all the residents that were displaced by these projects. A group of Tampa’s prominent African American businessmen, including Perry Harvey Sr., did manage to bid successfully for a contract to build housing; their organization, Tampa Park Apartments Inc., “developed about 370 subsidized rental units." “The Scrub” neighborhood itself was partially cleared in 1954; the 1968 “construction of the Jefferson Avenue approach to I-275,” and other projects in 1970 and 1972 removed the last vestiges of the once prosperous Central Avenue, and the dilapidated structures of “the Scrub."
|
WV Connections |
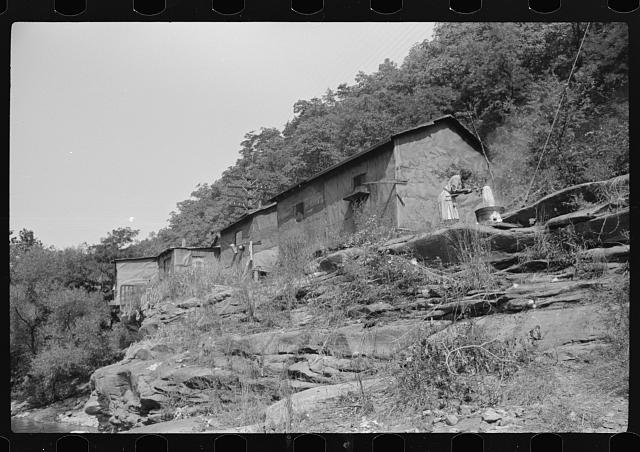
 Homes along Paradise Alley, in Charleston, West Virginia.  African American homes, in Charleston, West Virginia. |
|
Phases of urban renewal in "the Scrub" neighborhood. | |
|
|
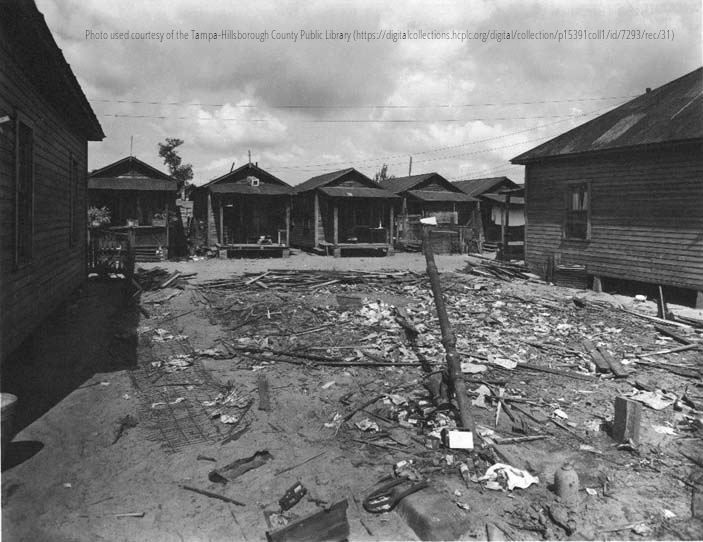 A lot, in "the Scrub," that has A lot, in "the Scrub," that hasbeen cleared for urban renewal (1952). |
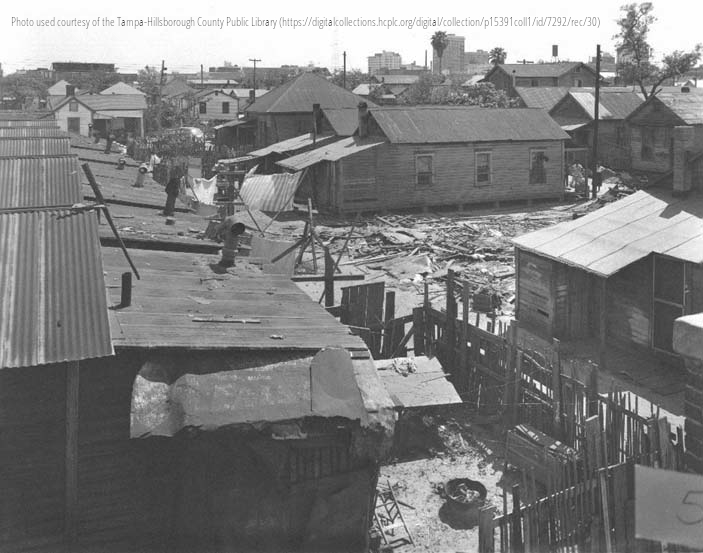 A bird's eye view of cleared lots (1952). A bird's eye view of cleared lots (1952). |
 After "the Scrub," had, mostly, After "the Scrub," had, mostly,been cleared for urban renewal (1953). |
For additional details on the Cultural History:
Cultural History Chapter with Bibliography
Research Background
The purpose of this chapter is to discuss the subsurface sampling methods employed at Perry Harvey Senior Park, and the site-specific rationale behind the selection of the methods. Due to the abundance of historical records regarding the development of this Tampa neighborhood, and the fact that two archaeological excavations overlap this particular study area, this site provided an ideal opportunity to test manual “scissor-style” posthole diggers as a subsurface sampling tool in the investigation of urban archaeological sites. The potential for future comparison of the results of this study to the results or prior archaeological investigation should provide unique insights into the accuracy and applicability of the sampling method in the investigation of urban archaeological sites. This study directly addresses the applicability of manual “scissor-style” posthole diggers as a component of a comprehensive survey and sampling strategy at historic urban sites; furthermore, the study also attempts to determine how the interval between sampling locations affects the interpretive viability of the data retrieved. It is also hoped that the conclusions reached by this study will have an impact on future considerations about what constitutes “archaeological significance” in the exploration of “highly disturbed” urban sites.
There is certainly nothing novel about the use of “scissor-style” manual posthole diggers on archaeological sites; Arthur Caswell Parker used them in his exploration of “an Erie Village and Burial Site at Ripley, Chatauqua Co. N.Y." However, in the vast majority cases where posthole diggers have been used, they have been used as predictors for where it would be most profitable to place larger units. There is a general agreement among those that have used posthole diggers in subsurface archaeological sampling that it is a useful technique for determining the lateral extent of a specific deposit within a site; however, there has been much less attention paid to whether or not the technique leads to a better understanding of the spatial distribution of artifacts within a site or deposit, the location, extent, and nature of deposits within a site, or in identifying the temporal range of artifacts found within a deposit.
There have been some previous efforts to judge the overall effectiveness of using posthole diggers in archaeological subsurface sampling; for the most part, these efforts have been favorably inclined towards incorporating posthole diggers into an overall plan of combined survey and sampling techniques. Additionally, those attempts to validate the use of posthole diggers have regarded them as a means to rapidly deploy small teams of investigators; therefore, posthole diggers have been deemed efficient in regard to both time and money. There have been attempts to integrate the data recovered through archaeological subsurface sampling into a larger conceptual picture of activity at a site, but these efforts have largely been confined to rural areas rather that congested urban areas where there may be multiple episodes of disturbance to the archaeological context of a potential site.
Research Problem
The primary objective of this study is to determine whether or not manual “scissor-style” posthole diggers should be considered a legitimate research tool in subsurface sampling strategies at highly disturbed urban sites; and. if the method is determined to be legitimate, then what unit placement interval provides the most efficient yet still meaningful understanding of the lateral continuity of separate deposition areas within the site. This study will explore the legitimacy of posthole sampling by analyzing the data that was retrieved from the field, and attempting to derive from that data the full temporal range of historic use at the site and also any indicators of land use differences throughout the study area. In an effort to establish the upper end limits of interpretive resolution achieved through the sampling method every attempt will be made to determine from the retrieved data, whether or not an assessment can be made of socioeconomic and ethnicity factors in the site’s history; finally, it will be attempted to place the recovered artifacts into a larger conceptual framework in regards to site type and use. Finally, efforts will be made to establish how volumetrically consistent posthole sampling is; the resulting qualitative and quantitative data will be examined statistically.
Field Methods
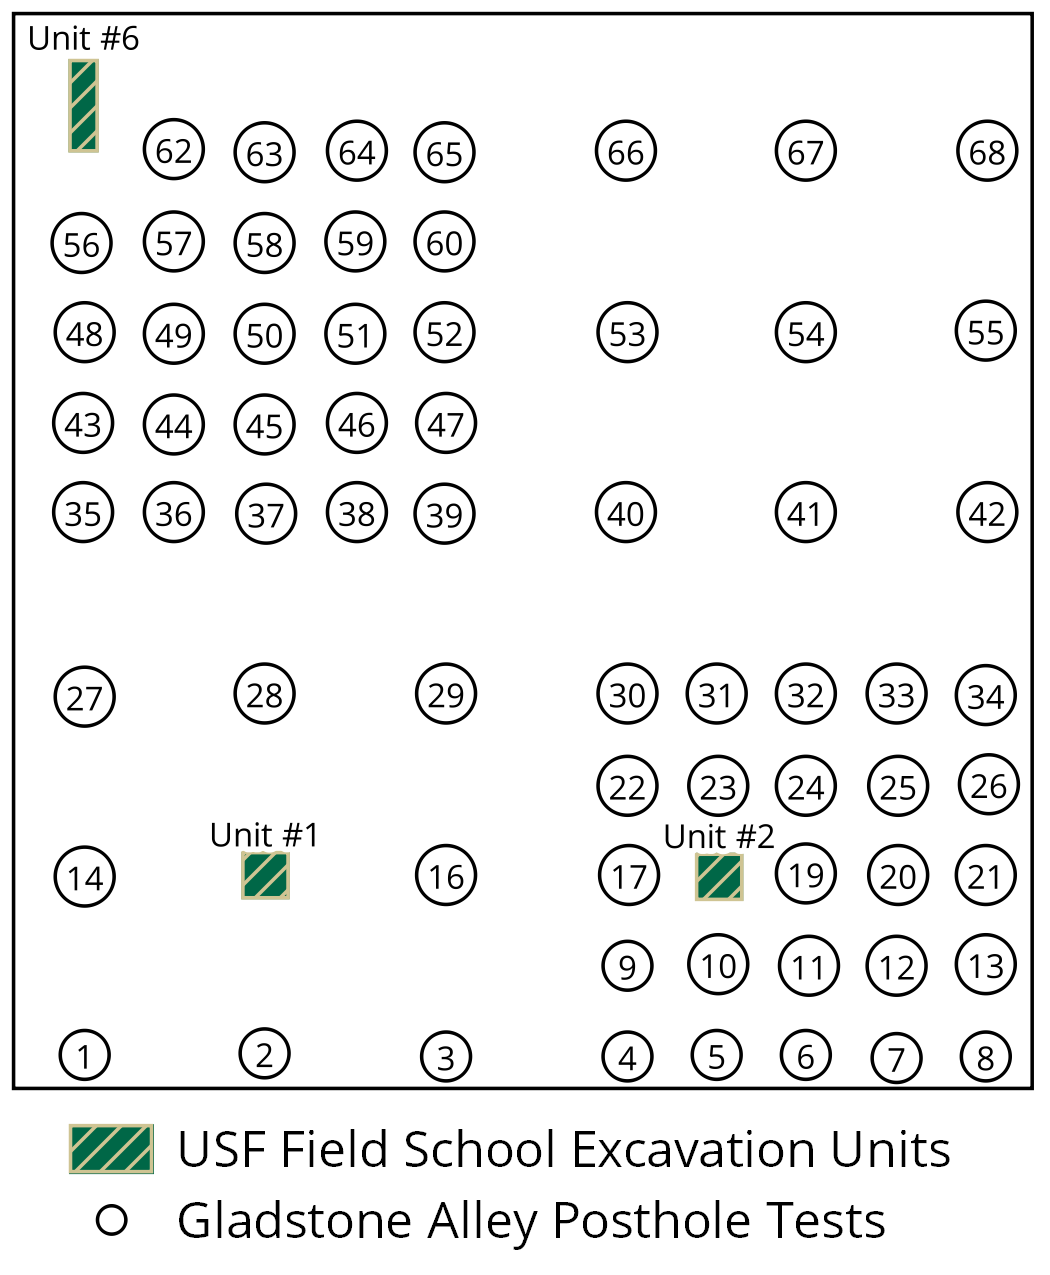
Gladstone Alley Project, posthole plan
The 100-foot by 100-foot study area was judgmentally placed to include information from both the former commercial structures, and the former domestic structures; the study area was then further subdivided into four 50-foot by 50-foot quadrants, starting with the northwest quadrant designated as Quadrant I, the designations continue clockwise as Quadrants II, III, and IV respectively. Postholes were placed in Quadrants I and III at 10-foot intervals, and in Quadrants II and IV at 20-foot intervals; units from the USF Field School interfered with the placement of one posthole in Quadrant III, and one posthole in Quadrant IV. Thus, there were a total of 66 units placed throughout the four quadrants; there were 25 units in Quadrant I, 9 units Quadrant II, 24 units in Quadrant III, and 8 units in Quadrant IV. The units themselves were placed on the same grid coordinate system as all the units that were part of the USF Field School; each unit was given a designation corresponding to its position on the grid system. A surveyor’s transit and a 200-foot vinyl measuring tape were used to delineate the boundaries and the center point of the study area; once the outline of the 4 quadrants were in place, 16-foot and 200-foot tape measures were used to locate the individual units in the study area. Each of those units was then demarcated with a multi-colored “pin” flag. The boundaries of the study area were also placed in a larger context, by taking GPS (global positioning system) coordinates; therefore, the exact position of the postholes can be located again in the future.
The units were then excavated with a “scissor-style” posthole digger, and the soil was passed through a 0.25-inch metal mesh screen into a white, plastic 5-gallon bucket. The units were excavated in arbitrary 6-inch levels, and notes were made at each level about the color and condition of the soil. All of the cultural material that was recovered from the units was recorded on a test record by level, however, given the extreme disturbance of the site, the decision was made to bag all material from a unit together with one field specimen number per unit. The only material that was not collected was brick fragments, and charcoal; in each case, the presence of those materials was recorded when they occurred in the unit, and then those materials were returned to the unit with the rest of the backfill. There was an abundance of brick fragments and charcoal throughout the study area, probably related to the demolition of the formerly existing structures; but it was deemed unprofitable to attempt to coax meaningful information about the archaeological significance of the site out of such minute and widely distributed materials. The intent of the study was to distinguish between positive (containing cultural materials) and negative (containing no cultural materials), however, there were no holes found that contained absolutely no cultural materials.
Furthermore, any soil anomalies seen in the profile of the unit, or indications of archaeological features (non-recoverable) were recorded on the Posthole Test Record sheets. In an effort to gauge the volumetric consistency of the method, it was decided that each of the units would be dug to a depth of two feet (24 inches); this depth was selected to ensure that the unit would be entirely within cultural soil strata, as know from soil strata profiles from the units of the USF Field School and from prior archaeological investigations throughout the city of Tampa. In cases of “hole refusal” (impassibility) upon first strike, the unit was moved one width of the blade end of the posthole digger to the south; in cases where there was “hole refusal” at greater depth, depth measurements were made, and the cause of “hole refusal” was noted on the Test Record forms. Measurements were also taken of the diameter of each unit at the ground surface; in cases where there was first strike “hole refusal” caused the hole to be moved, the full diameter included both holes because soil and cultural material from the first strike was screened and artifacts were saved.
See the original field record form:
Posthole Test Record
Laboratory Methods
The first step in the laboratory was to record all of the field specimen numbered bags into a master log; the log accounted for all bags associated with each unit, and indicated why specific numbers had no corresponding sample bags (i.e., samples that were not taken because there was a unit from the 2003 USF field school at those coordinates). The artifacts were then sorted by material composition (recorded as Artifact Class); the glass, plastic, and ceramics were cleaned in a mild detergent solution, and the other materials were cleaned with a dry brush and dental picks. Once the artifacts were cleaned and allowed to air dry on racks, they were further subdivided into groups judgmentally according to Artifact Type (i.e., an artifact classed as a Ceramic would be further subdivided into Artifact Types such as ironstone, earthenware, or porcelain); the extremely poor condition of the majority recovered material made it difficult to assign some of the material (such as glass) to a Type with absolute certainty. After the materials were sorted by Type, they were assigned a catalog number together as a category; the catalog numbers were assigned by the year of excavation (03), the location of the study area (GA for Gladstone Alley), field specimen number (1-68), and finally by material grouping.
Artifacts that were identified as being particularly diagnostic were assigned individual catalog numbers at the material grouping level; these artifacts were photographed for the purpose of being included in the final report. Every effort was made to detect the form and function of each artifact, but much of the material was in the form of very small fragments, which could not be assigned a form with reasonable accuracy (occasionally function was detectable even when form was not readily apparent); in cases where form and function were not able to be determined, the notations about condition reflect the fragmentary character of the artifacts in question. Any special characteristics or features that were not otherwise addressed were noted separately, and each catalog number was assigned to a larger conceptual category of artifacts; it was not expected that these larger conceptual categories would provide meaningful information about the overall site, but it was hoped that by comparing the resulting percentages assigned to each category in each of the units, that an understanding might gained about artifact patterns in the development of the site. The long-term goal in establishing artifact patterns at this site through results from postholing would be to compare those percentages to percentages arrived at through more intensive subsurface investigation; if the percentages were comparable this specific site, then conceptual categories of artifact patterning might be arrived at in a multitude of sites throughout the city of Tampa.
Each artifact was visually inspected for features or characteristics that could indicate the date range of a specific artifact or artifact type in general. The entire contents of each posthole were weighed on an Ohaus (brand name) scientific balance that displayed the weight by half-gram increments, and that weight was recorded on the artifact analysis sheet for that unit. Each Artifact Type was weighed in the same manner for each posthole; that weight was recorded individually, and also expressed as a percentage of the total weight of artifacts from that posthole. To compensate for the fact that the weight of any given material category might be indicative of the presence of one extremely large and heavy artifact, or a large number of extremely small artifacts, the number of individual artifacts comprising each material category was also recorded for comparison. The weight of material attributed to the larger conceptual categories of artifact patterning was also recorded for each category, and that weight was also expressed as a percentage of the total weight of artifacts from each individual posthole.
See the original artifact analysis form:
Artifact Analysis Worksheet
Geospatial Methods
In 2016, the author became aware of a planned “grand opening” of a Perry Harvey Sr. Park, with new amenities, including a series of markers and artistic installations that commemorate the Central Avenue commercial district, and “the Scrub” neighborhood. Over the years, I had revisited the Gladstone Alley Project data several times, with a desire to complete aspects of the analysis that I had not accomplished through my earlier research; in particular, I had always wanted to compare the results of the Phase I archaeological survey, the 2003 USF Field School, and my own Gladstone Alley Project. It was entirely due to my own naivete that I expected a complete artifact analysis from the 2003 USF Field School by the time I published my results from a much smaller project. However, I was able to compare my results to the results from the Phase I archaeological survey.
I had retained the GPS coordinates of the Gladstone Alley study area, so I was able to digitize a 100-foot by 100-foot square, and tie the southwest corner to the actual GPS coordinates of the original study area. I also digitized the position of the individual posthole tests, and entered the original posthole data into the database associated with the shapefile I created. I georeferenced aerial imagery of “the Scrub” from the early1950s, from the Tampa-Hillsborough County Public Library’s collection of Burgert Brothers photographs, so that I would be better able to match the Sanborn maps from 1951 to identifiable features from the entire neighborhood. I, then, georeferenced the 1951 Sanborn map for Block 120, at the original scale of the drawn map, which resulted in a good fit to the last configuration of the built environment for the study area. I georeferenced the earlier Sanborn maps with reference to contemporary aerial imagery, historical aerial imagery, and especially the 1951 Sanborn maps that I had previously georeferenced.
Since the data were expected to be continuous, beneath the ground surface, I selected kriging as the most appropriate method of interpolating my vector data into a raster data model of expected deposition across the entire study area. I weighted my data according to the testing interval used in the study (i.e., 10 or 20 feet). This analysis was confined to the total weight of materials recovered from each test unit. Unless otherwise specified, the underlying rasterized geospatial data shown in the resulting maps relates to the total weight of all artifacts recovered from that unit.
In an effort to get beyond the limitations of using the total weight of recovered materials, I converted the counts and weights for specific categories of artifacts to standard deviations from the mean, and used an unweighted mean of the two z-scores to create a “total productivity” unit of analysis. The material categories converted to z-scores were: Total Weight, Bone, Stoneware, Bottle Glass, Flat Glass, Construction Materials, Construction Metal, Other Metals, and Count. Furthermore, the z-scores for the categories of Bone, Bottle Glass, and Stoneware were averaged as an estimate of Domestic productivity; and, similarly, the z-scores for Construction Materials, Construction Metal, and Flat Glass were averaged into a total Architectural productivity. The resulting Domestic or Architectural z-scores were then compared to the total productivity of the unit, expressed as a ratio.
For additional details on the Research Background:
Research Background Chapter with Bibliography
Results
Excavation of the test units took place over two days on 16 and 17 June 2004; the study benefited from available “free labor,” from the USF Field School. The excavations on the 16th involved only one team of 3 people (although several people rotated in and out throughout the day) one to dig, one to screen, and one to keep records; over the course of 4 hours, the team managed to dig 20 holes (units 48-68, excluding unit 61). On the 17th, two teams of 3 people excavated the remaining 45 units (1-47, excluding 15 and 18), over the course of 5 ½ hours. Therefore, the first day’s team averaged roughly one hole every 12 minutes, digging, screening, recording and backfilling each hole, and moving a sunshade to each new unit location; the two teams on the second day averaged approximately1 hole every 14 minutes and 40 seconds.
The volume of soil removed from each unit did vary somewhat, mostly depending on the individual manning the posthole diggers, the condition of the soil in the vicinity of the unit, and the presence of material in the ground that forced lateral movement of the posthole diggers. The diameters of the holes ranged from 6 to 11 inches, with a mean diameter of about 7.9 inches and a standard deviation of nearly 1 inch; the mean hole depth was about 20 ¼ inches due to hole refusal in some units. The total volume removed per unit averaged 1,028.5 cubic inches compared to the optimal volume of 1,181 cubic inches; moreover, there was a large variation, with a standard deviation of 454.8 cubic inches.
|
Table 1. Variation in Excavated Postholes | |||
|---|---|---|---|
|
Diameter (in.) |
Depth (in.) |
Volume (cu. in.) | |
|
Count |
65 |
65 |
65 |
|
Median |
7.5 |
24 |
1060.288 |
|
Mean |
7.915 |
20.246 |
1028.478 |
|
SD |
0.997 |
0.791 |
454.763 |
|
Minimum |
6 |
2.5 |
96.211 |
|
Maximum |
11 |
24 |
2280.796 |
Artifact Analysis
As stated previously, every hole was “positive,” in the sense that cultural material was recovered from every unit. Most of the recovered material was in extremely poor condition; the bulk of the recovered material consists of small shards of glass, metal, and ceramics. In the lab, it became apparent that almost all the recovered artifacts would be assigned to the groups: Domestic, Architecture, and in a distant third place, Personal; there was only one artifact, a sparkplug (Unit #48), assigned to the Transportation group, and only one artifact, a 1981 Lincoln Penny (Unit #59), was assigned to the Commerce & Industry group. In no case, was an artifact assigned to the Group Services or Group Rituals groups.
A total of 5,257 artifacts were recovered, however, given the fragmentary nature of the majority of the material it became preferable to deal with weight instead of counts; the total weight of recovered artifacts was 10,915 grams (24 pounds). The weights were used to calculate an expected percentage for every material category; in theory, if the artifacts categories were evenly distributed throughout the study area, then each unit would contain the same percentage of each material category. The distribution of artifacts was not even throughout the study area, and the varying artifact distribution densities may correspond to places where deposition occurred during the sites period as a habitation site rather just being randomly redistributed through disturbances created by the demolition of the houses during urban renewal episodes.
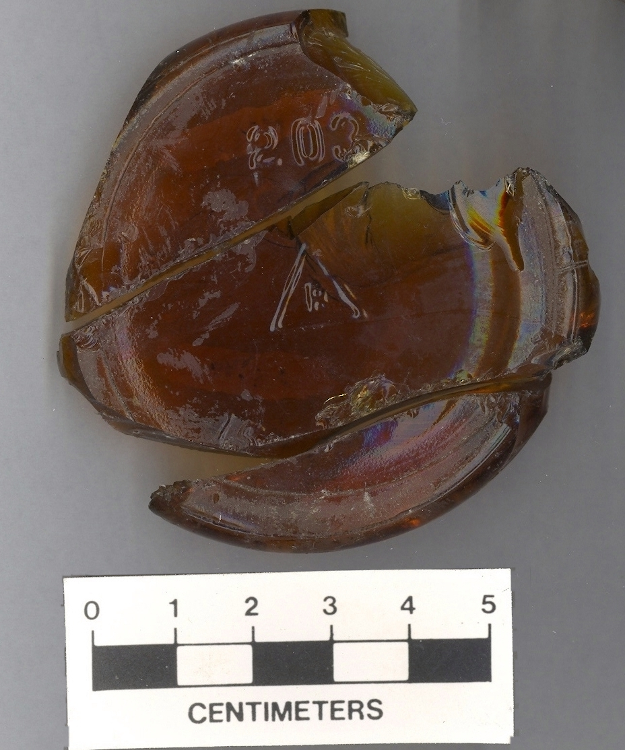
Brown glass bottle base,
Reed Glass Co.
Bottle glass represented the largest quantity of recovered material; as with most of the recovered material, the shards were for the most part to small, and lacking in markings to positively identify. However, a significant amount of amethyst glass was found throughout the site, including a bottle finish (Unit #59) with a smooth steep-sided lip, string rim, and irregular “cork seat” on the interior of the lip that is likely to be from a short-necked liquor bottle; a bottle finish with a flared lip, and distinct patinization, that may be from either a patent medicine or “toilet water” bottle (Unit #29); and another partial finish that is likely from a patent medicine bottle. This amethyst glass appears to be discolored from exposure to ultraviolet light; the coloration of these shards is likely to have resulted from a reaction between sunlight and the manganese that was used as a decolorant. Manganese was used as a decolorant from the mid-1880s to the end of World War I; and given the morphology of the bottle finishes, it seems likely that these examples date from that period.
Another brown glass bottle base had a manufacturer’s mark (a capital “R” in a triangle) that could be traced to the Reed Glass Co. of Rochester, NY, and was in use by that company from 1927-1956 (N.B. the SHA bottle glass list of maker's marks says 1923-1956).PDF Several other shards of glass had embossing that proclaimed “Federal Law Prohibits Reuse or Resale of This Bottle;” this message came into use after the repeal of Prohibition, and remained in use until the mid-1960s. One small, glass shard appeared to be unmarked until it was held at an angle to a light source in the laboratory; in transparent letters it read “if it’s Borden’s, then it’s got to be good,” but it is not clear whether the writing was intended to be transparent or if it was perhaps “pyroglazing” that had worn off over time. Finally, three glass “club sauce style” bottle stoppers were recovered; these “were one of the most common glass bottle stopper styles of the late nineteenth/early twentieth” centuries.
Construction related metal, and other construction materials combined, made up a little more than 40 percent of the total recovered weight. Most of the “Construction Metal” category was made up of nails and nail fragments; there were both cut nails and wire nails of various sizes. “Construction Materials” included pieces of roofing tiles, grooved wood or possibly asbestos molding that had been painted green, and chunks of concrete. Other related items, included a brass spigot manufactured by “Republic,” and an approximately 8-inch segment of 0.75-inch diameter copper pipe; the spigot appears to be an outdoor type. Domestic metals were represented by many bottle caps for crown cap type bottles, and spoon stamped “Kensington Silver Plate” on the back of the handle.
 Kensington silver plate spoon.
Most of the flat glass recovered from the study area was determined to be window glass of some sort; it is probable that this glass is related to the windows of historic structures; however, some of it could be related to glass from picture frames, or furniture (all flat glass was assigned to the Architecture group). None of the flat glass appears to be related to automobiles. Several pieces of decorative cut class were recovered, including a shard with cross-hatching on the convex side, a shard of blue glass with etched designs of small flowers and vines, a shard with points on the convex side, and piece of iridescent “carnival glass” decorated with flowers that may be “depression era,” but could not be positively identified as such.
A significant amount of bone (128 grams) was recovered from this relatively small area; all of it was identifiable as faunal remains. There was good mix of species represented, with chicken or other poultry being the most common; there were also bones from larger domestic animals such as pigs or cows, and a number of fish vertebrae. Several of the larger bone fragments showed definite striations, indicating that they had been cut with a meat saw (rather than clean cuts such as might be seen if the meat were prepared with a cleaver).

Ceramic with scalloped edge,
and flow blue transfer print.
The overwhelming majority of ceramics recovered from the study area were sherds of undecorated, white ironstone; Unit #58 yield a large quantity of what appeared to be one large dinner or serving plate, several pieces were cross mended, but there were no identifying marks. One sherd (Unit #21), has a “flow blue” transfer print on a scalloped and beaded rim; this piece seems likely to be from the “late Victorian” period from 1885 to 1920 (Lenzner n.d.); another sherd has a similar color transfer, but the paste is much harder and it is very thin (it appears to a more modern vessel, perhaps a vase). A few very thick-walled vessels also appear to be ironstone; one of these vessels (Unit #24) shows definite blue “pooling” in the glaze, but it is most definitely not pearlware as evidenced by the well vitrified paste.Find out more with the FLMNH Ceramics Database
A wide variety of personal items were recovered from the study area. None of the artifacts were particularly diagnostic. Included in this category were safety pins and other metal clothes fasteners; especially interesting were a brass cufflink, 2 mother-of-pearl buttons, and a small, ceramic button. Two expended .22 caliber shell casings (both rimfire), and one .45-70 caliber shell casing (centerfire) were also listed as personal items. An ornate piece of costume jewelry with a tri-leafed design, and set with yellowed, plastic gems, and several fragments of one or more LP records were also discovered. The site also yielded a number of items that were definitely children’s toys; these included a metal jack, the “flip-up” part of the barrel from cap gun, a clear, glass marble, and a soft metal, and a finger ring that appeared to have a setting for some sort of adornment.
Revised Spatial Analysis
This section replaces the previous spatial analyses, conducted over the 2003 USF fall semester, and submitted early in 2004 USF Spring semester, so that it could be included as an appendix to the final report to the FDOT. The previous analyses relied on creating course-resolution choropleth maps representing artifact densities, and transparencies that had been created from black and white copies of Sanborn maps. The resolution was suitable to the results being presented, and the ensuing discussion; unfortunately, it was limited to total weight, along with a limited selection of artifact groups. The version that was previously published through the FDOT’s website had additional software interoperability issues that stemmed from my decision to assemble my document in Microsoft Publisher.
The previous analyses did successfully identify a fair bit of the full temporal range of the neighborhood, and several of the analytical groupings did appear to suggest meaningful associations with the occupation periods of the neighborhood. I think the previous use of z-score in the category of total weight recovered from test unit was a step in the right direction. Urban environments are a sort of continuous palimpsest; what Amos Rapoport called the non-fixed feature elements (i.e., living beings) are in constant interaction with the semi-fixed and fixed feature elements of their urban environment, and this generates a variable pattern within the dominant landscape usage trends. On the other hand, large swaths of land can be brought to a builder’s level, and become sealed away beneath the foundations of commercial and/or industrial buildings that signal the shift to the next continuous palimpsest for that locality. With the passage of time, these deposits may survive to become the weathered and compressed discrete occupation layers of the type more familiar in prehistoric archaeology.
As a means of representing information visually, a GIS allows for a wide range of outputs, from a simple plotting of the location of artifacts assigned to the Personal category, with a special reference to buttons or excavation depth, to representing more complexly constructed variables. The use of ratios within units was abandoned, but the Architectural results are included here for the purpose of later discussion.
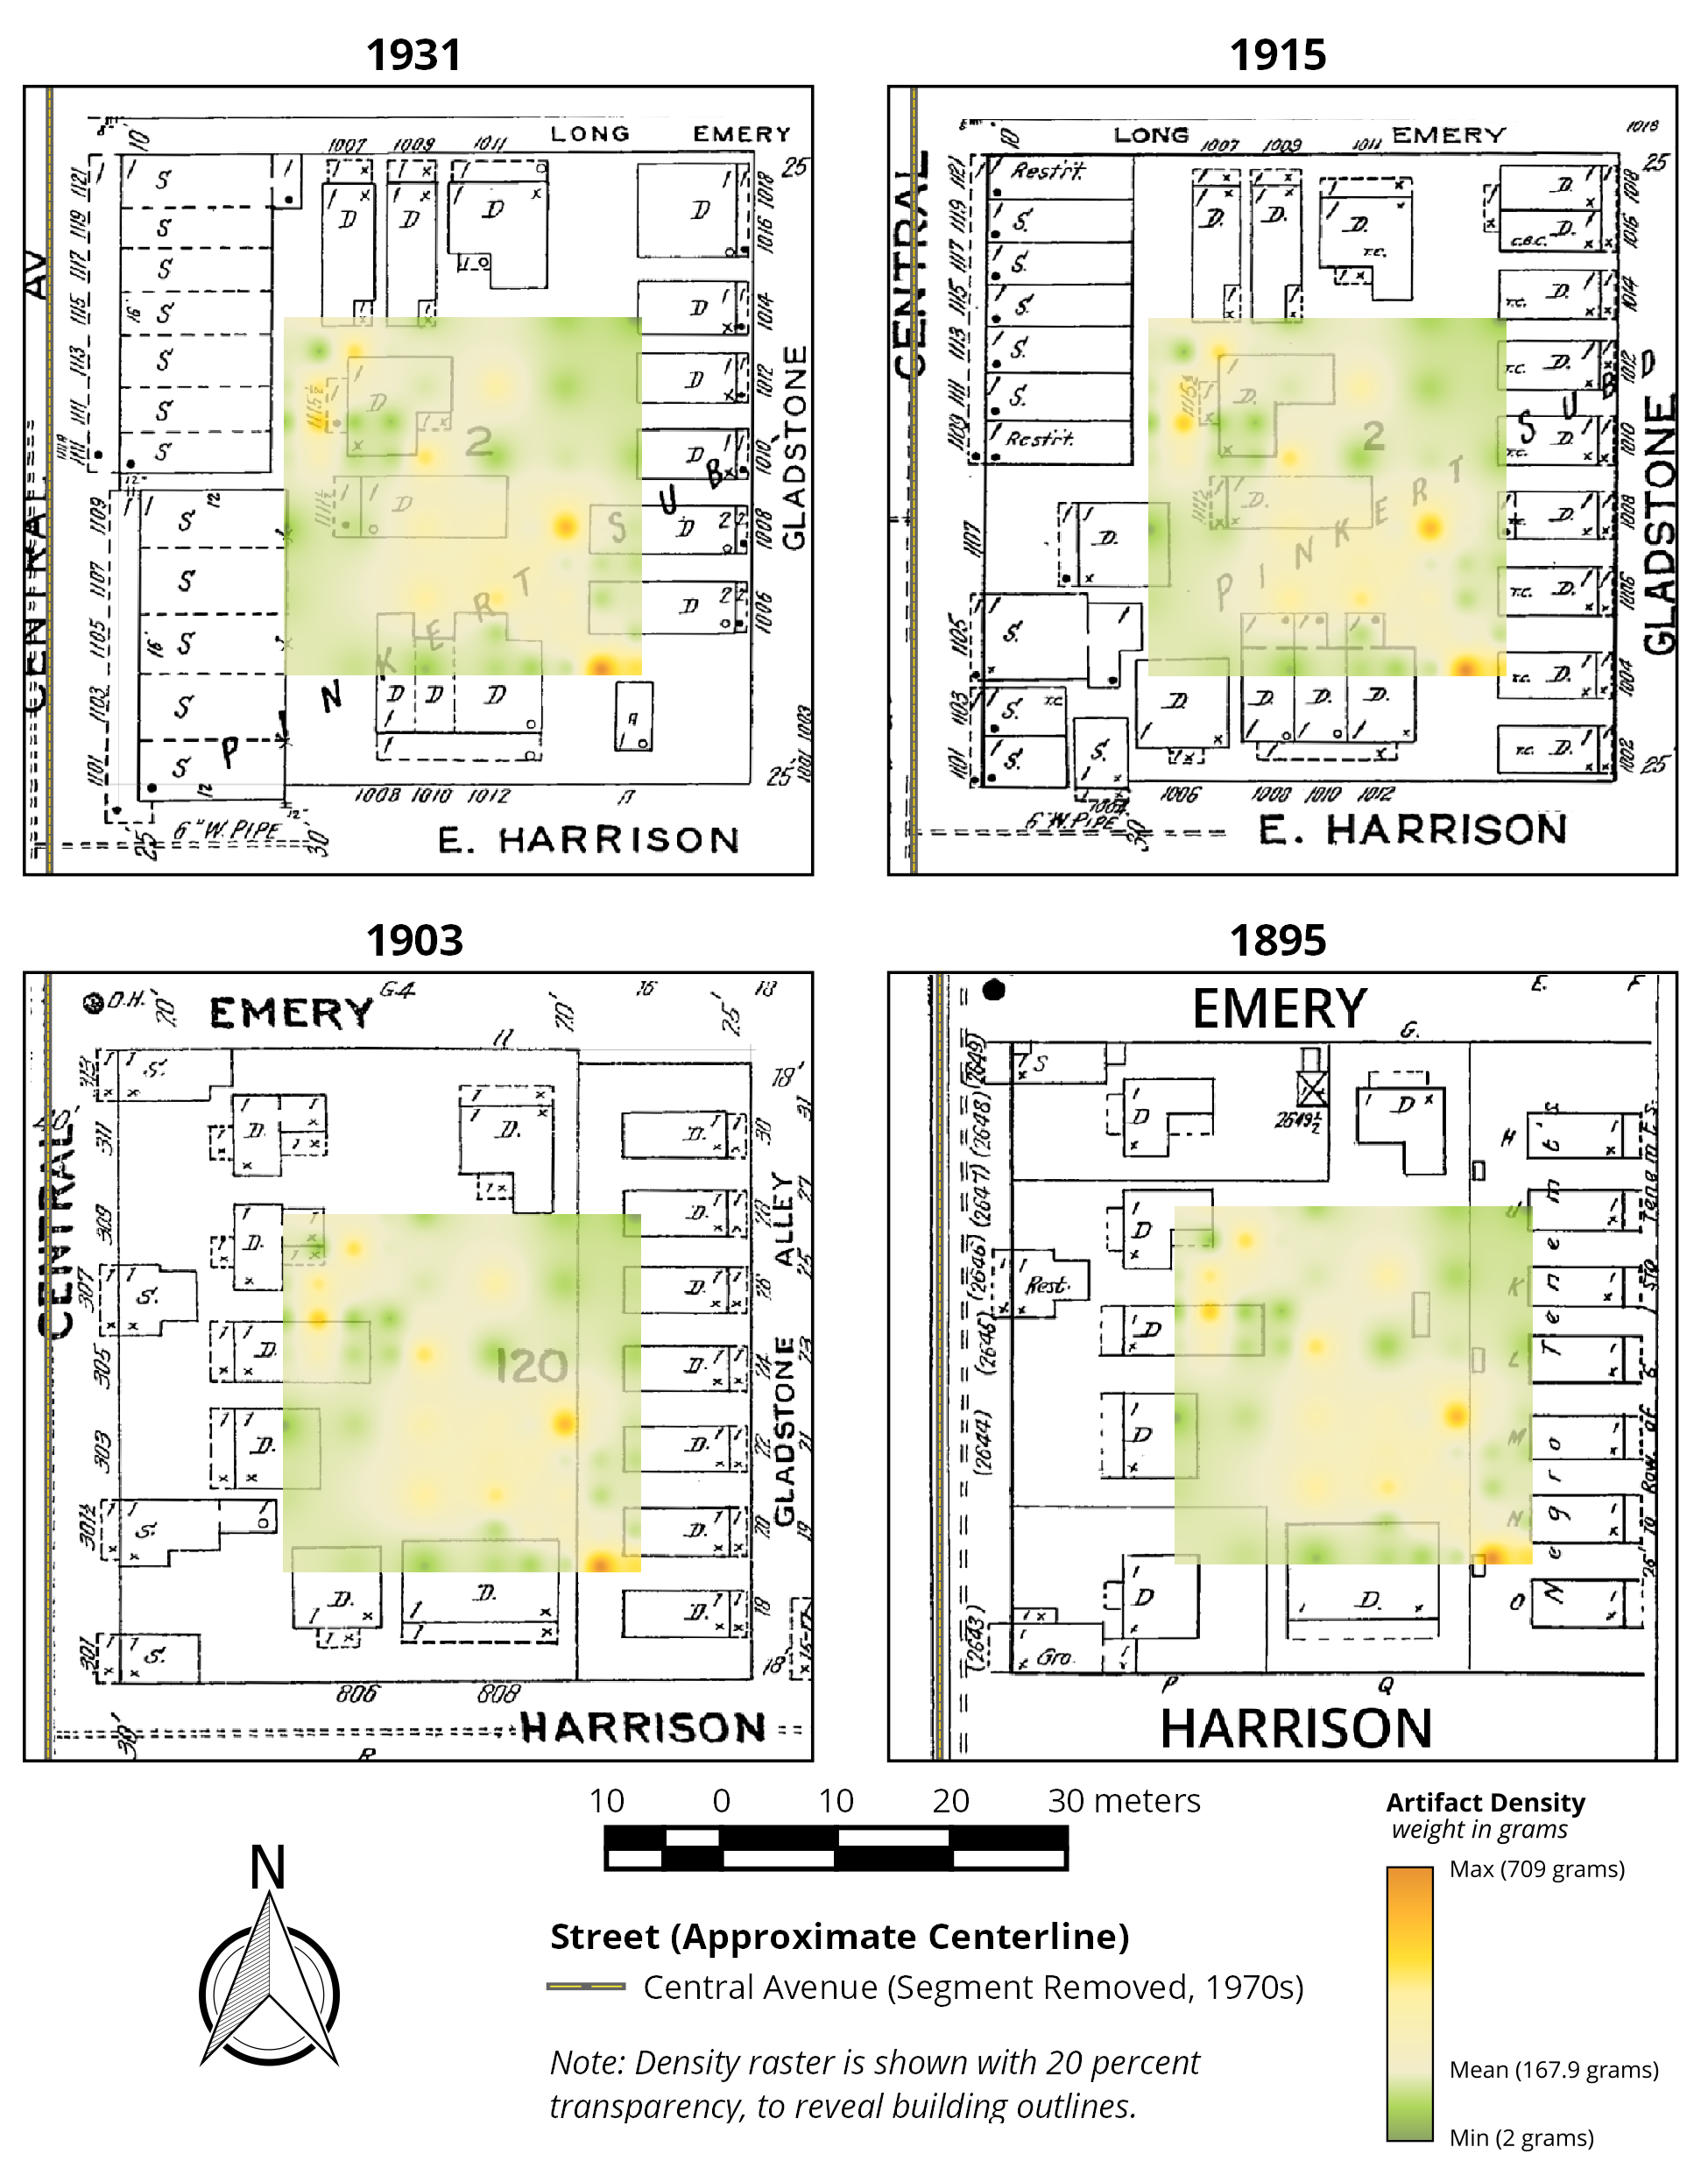
Gladstone Alley Project,
Total Weight
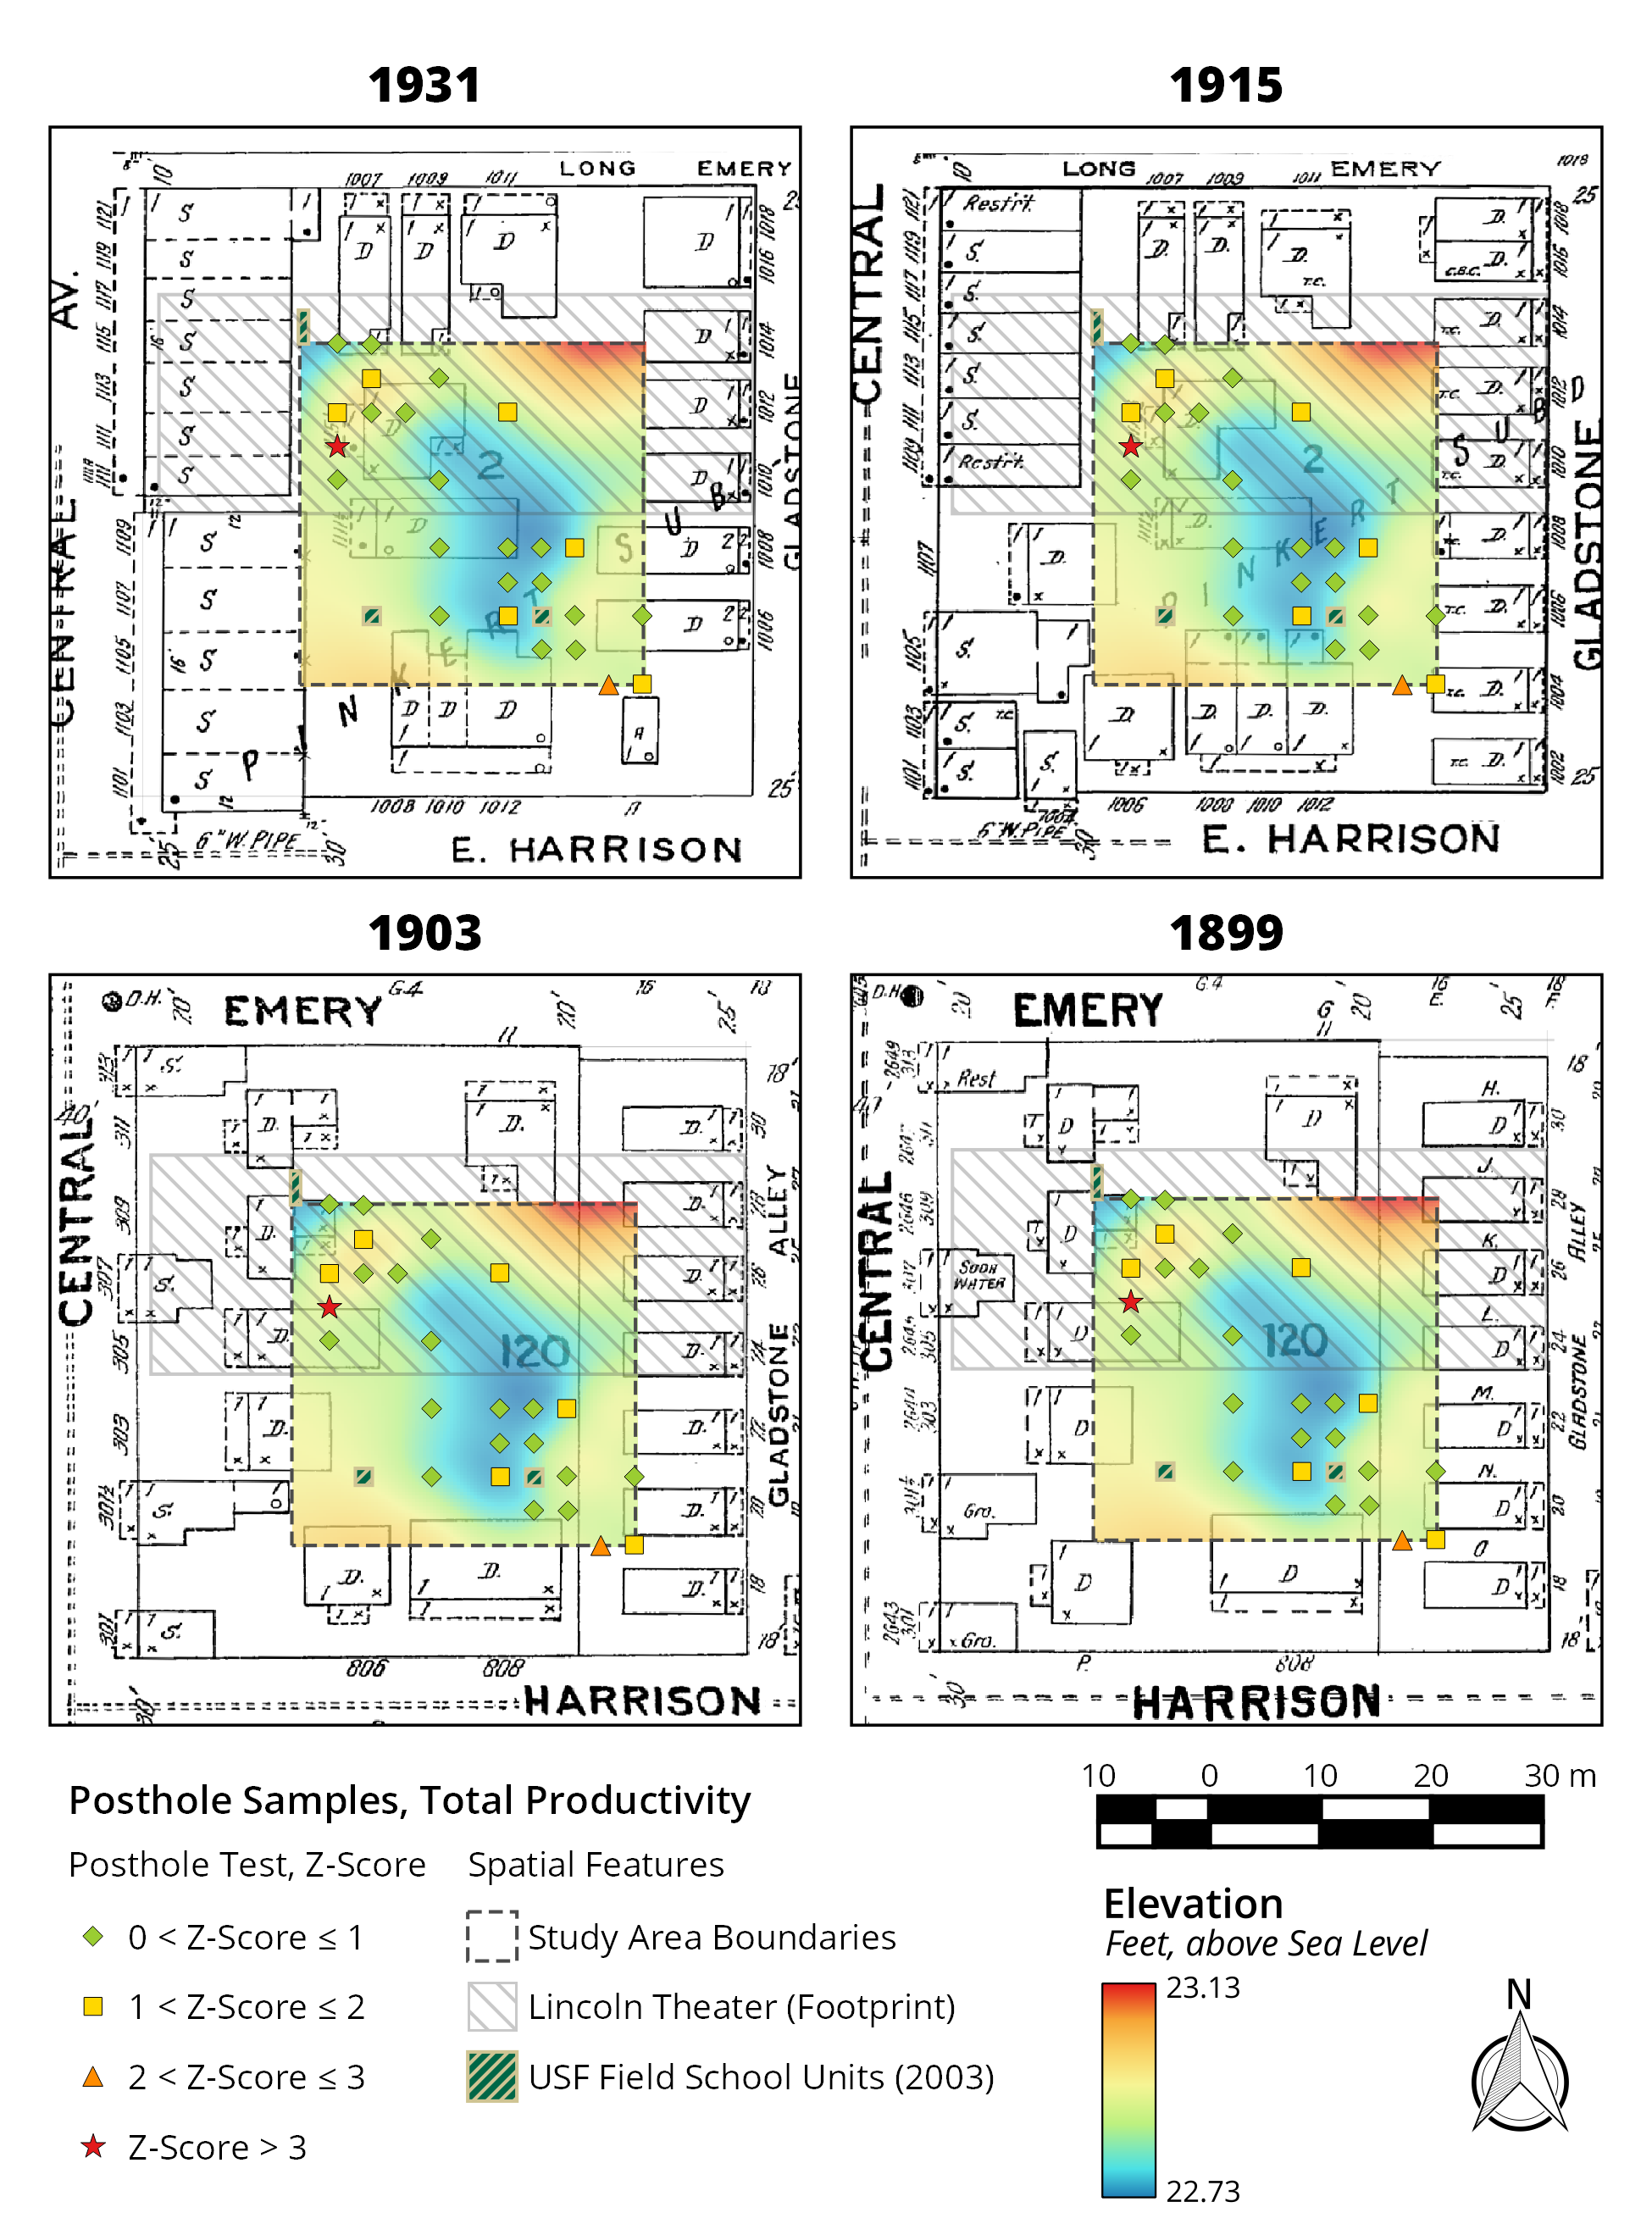
Gladstone Alley Project,
Total Productivity
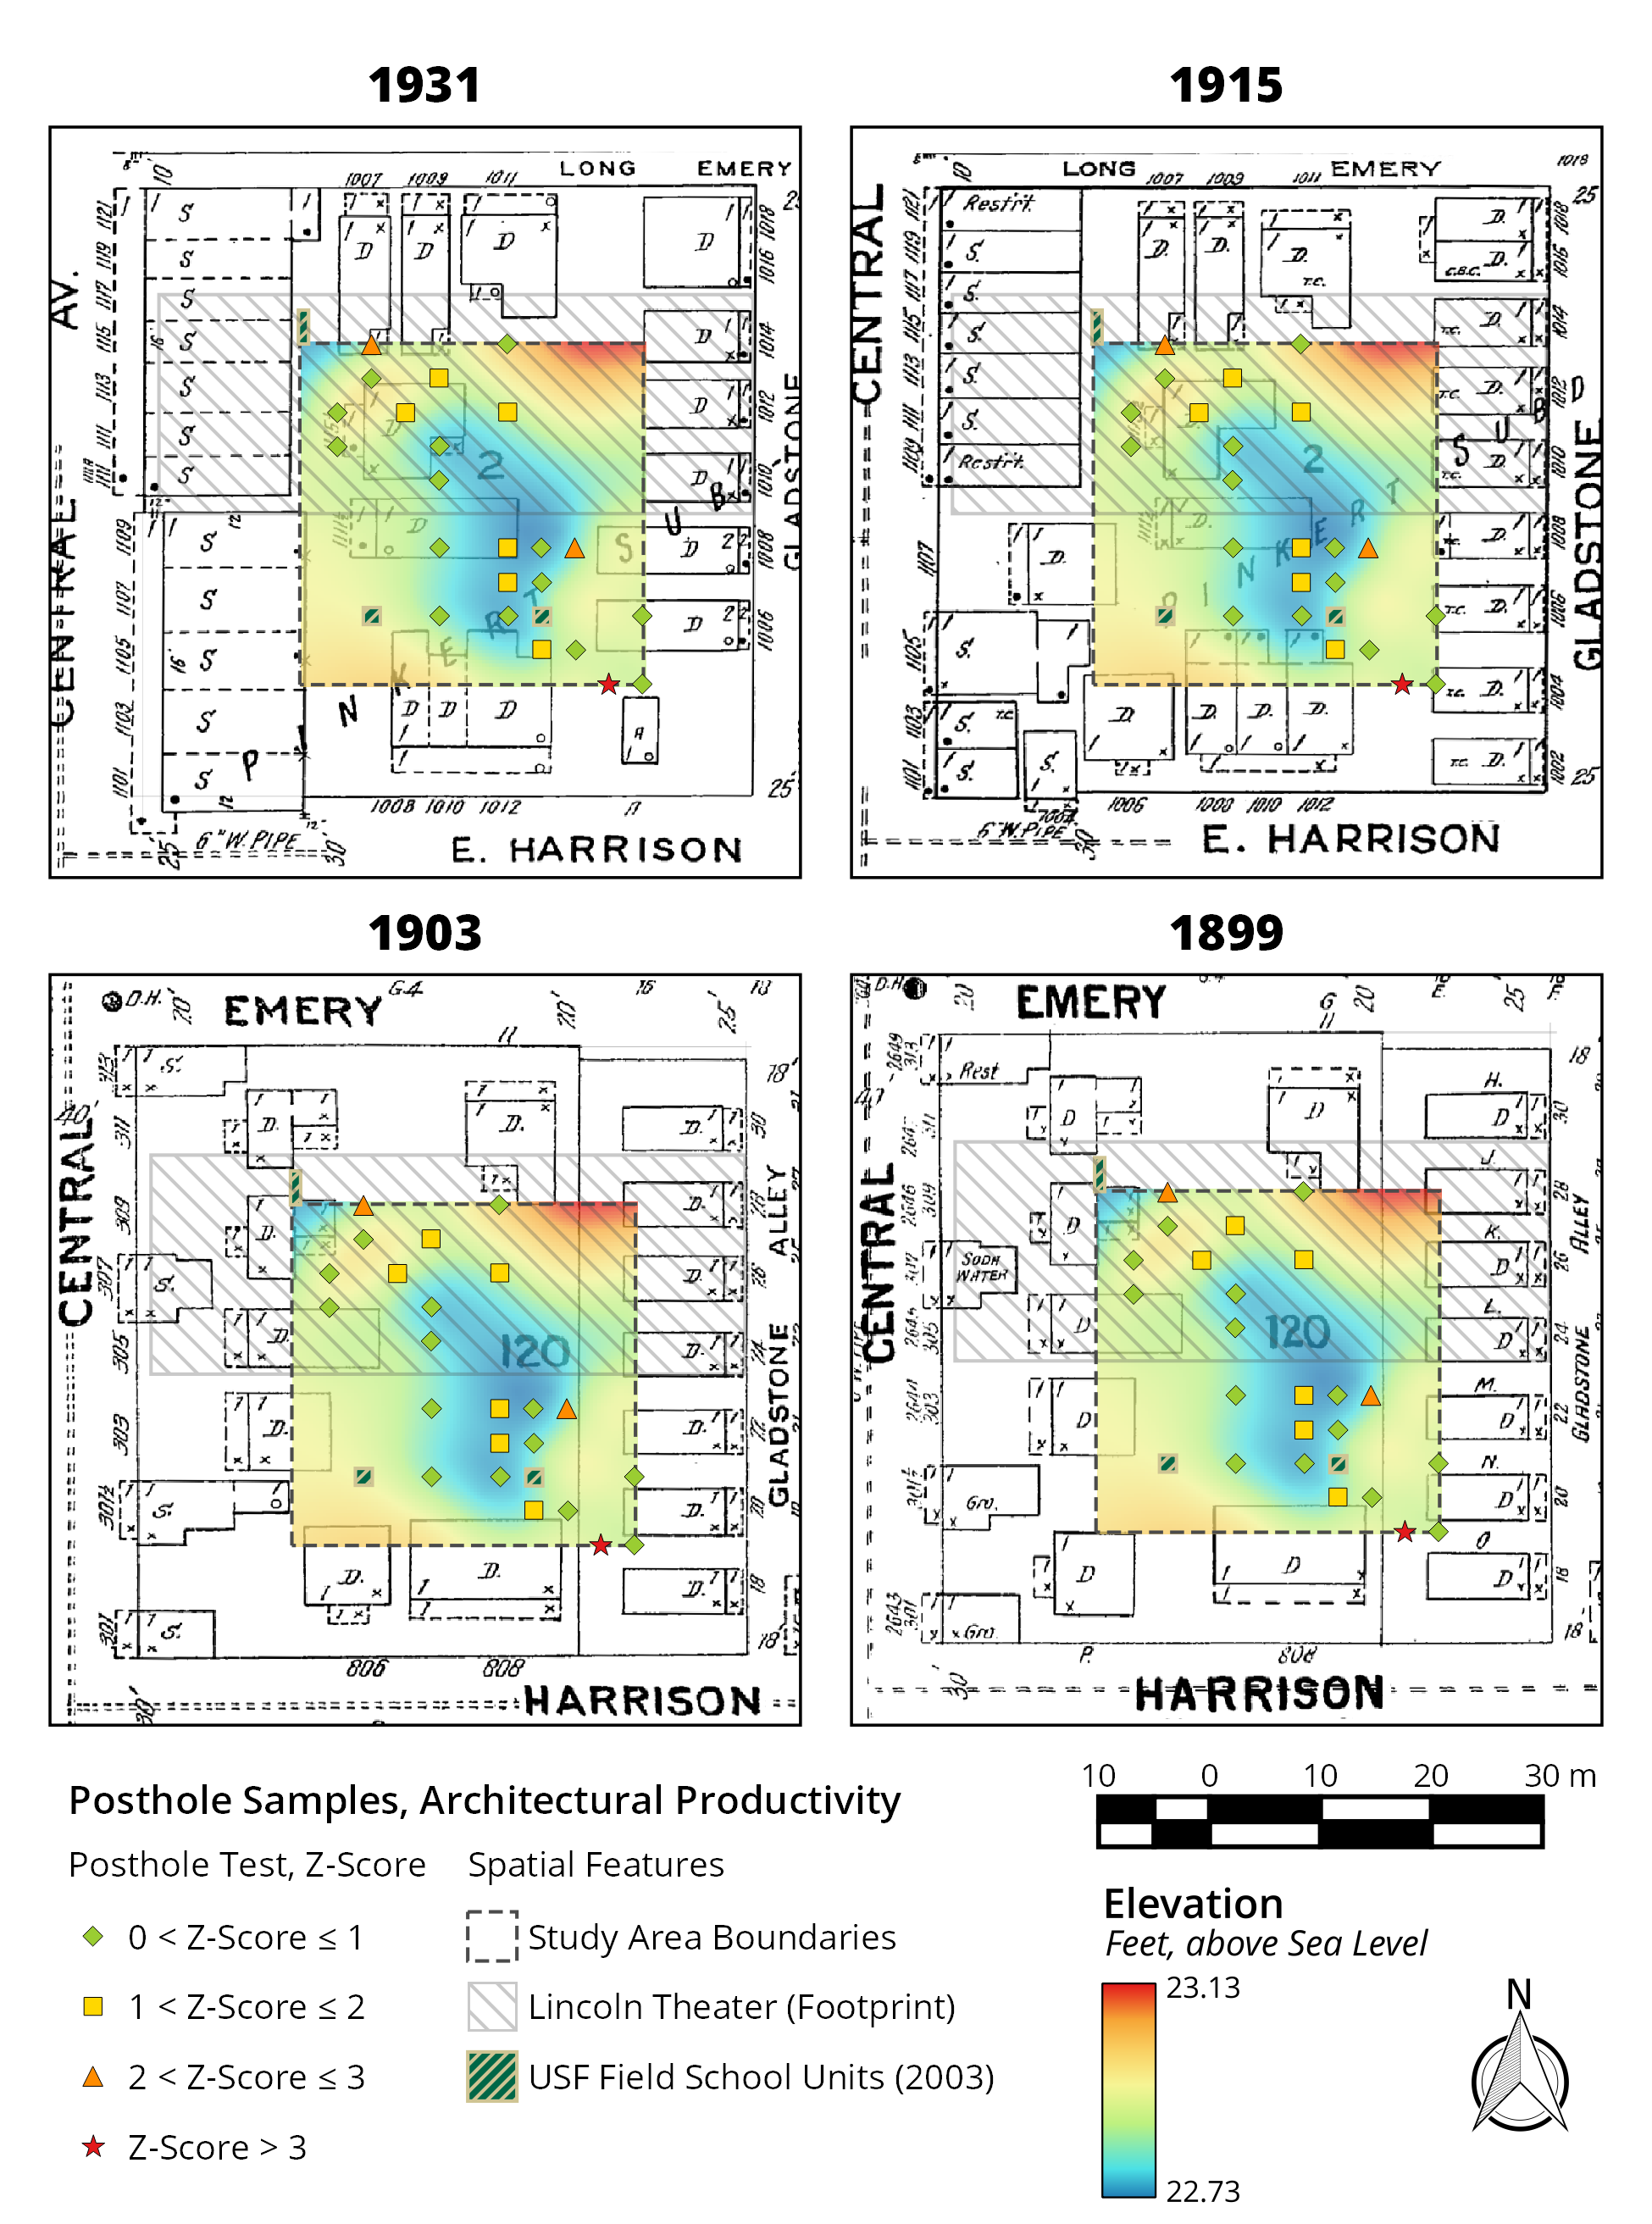
Gladstone Alley Project,
Architectural Productivity
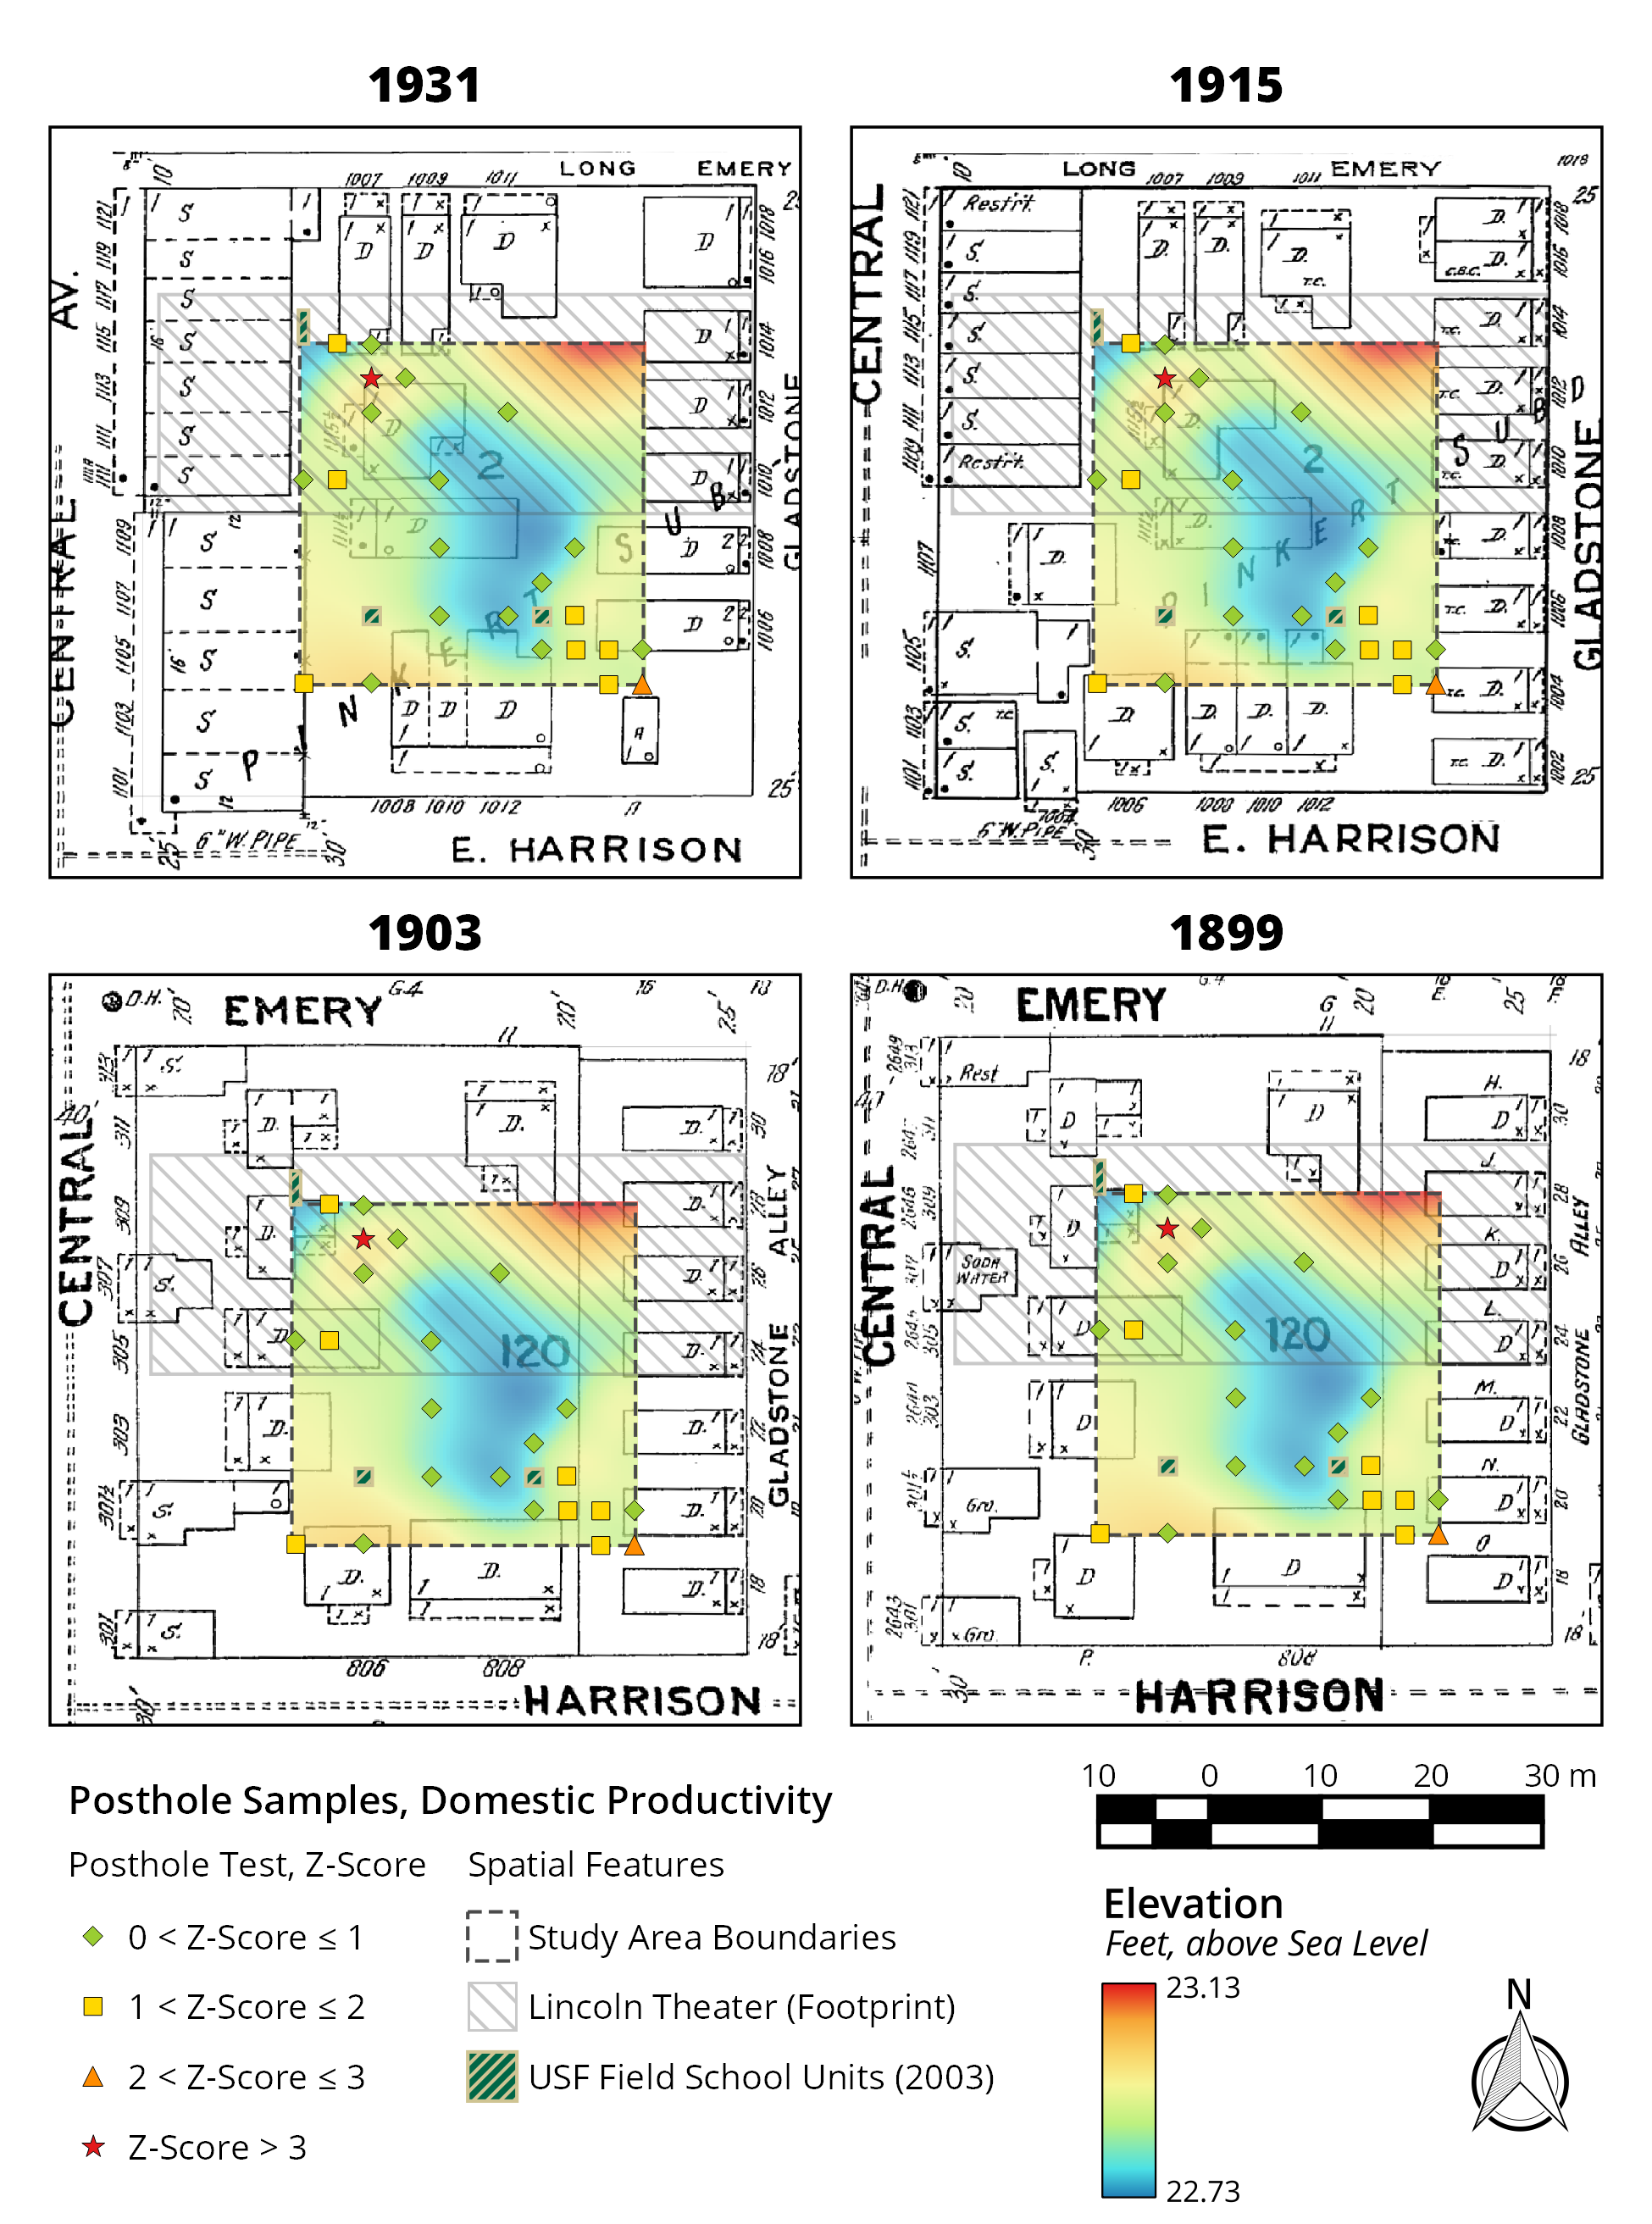
Gladstone Alley Project,
Domestic Productivity
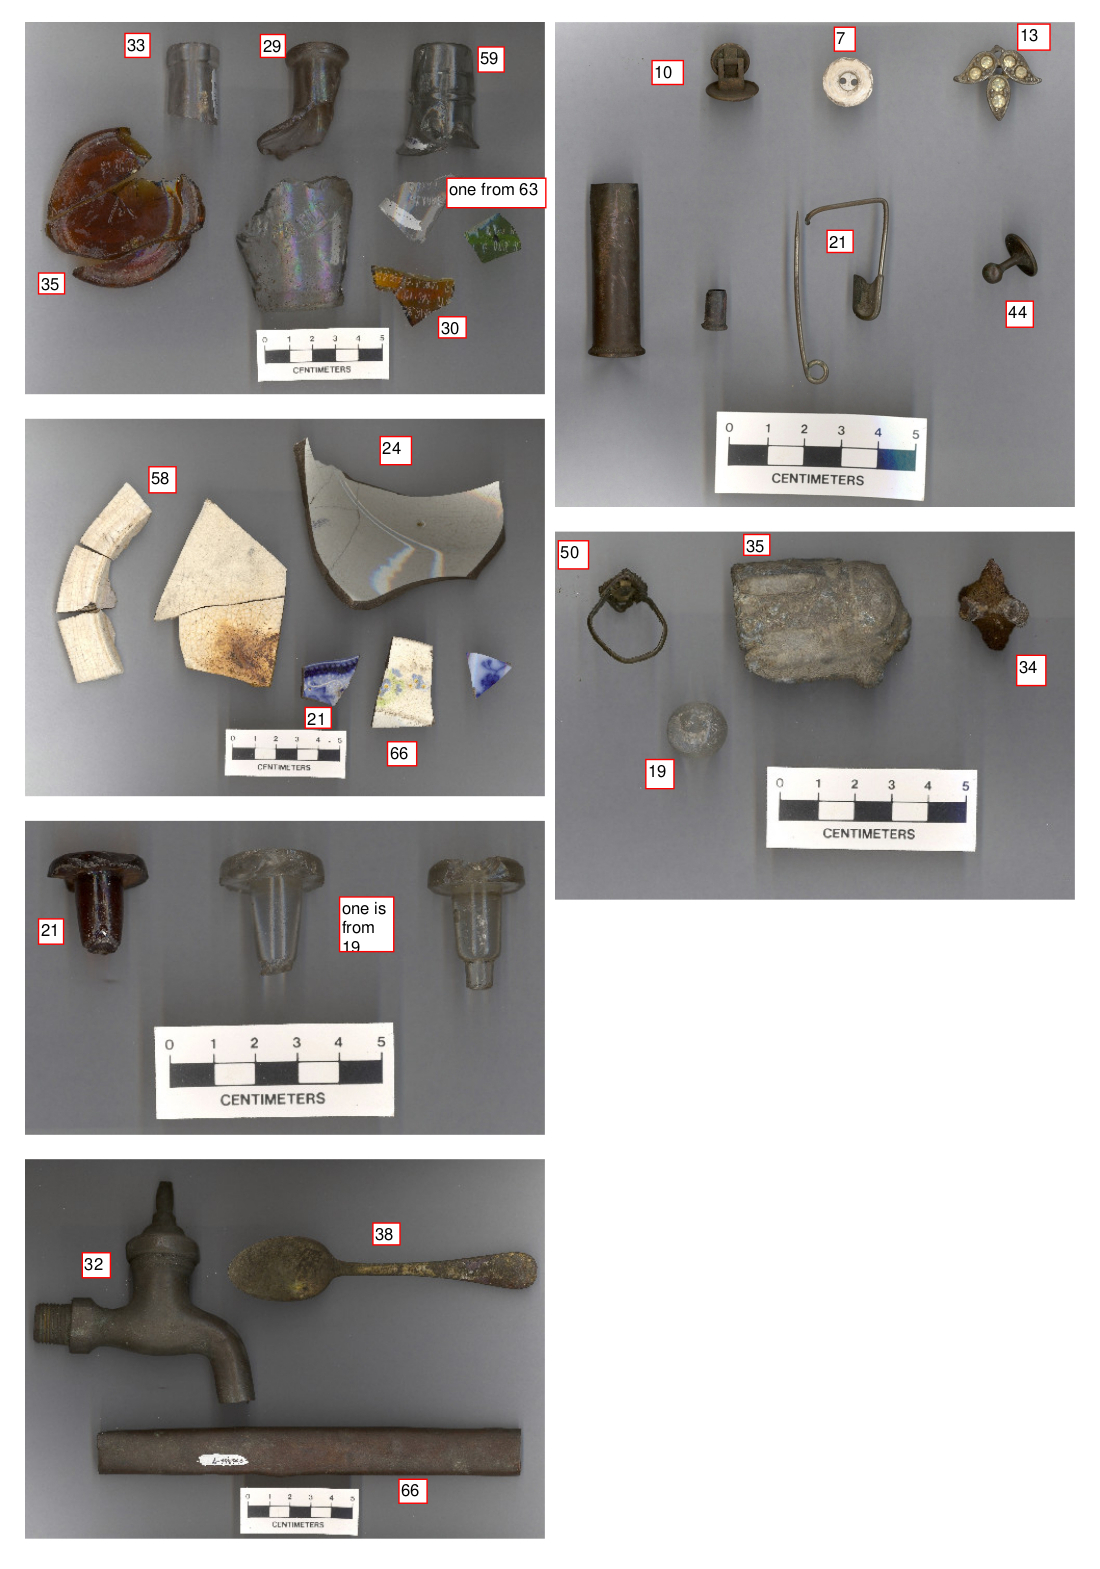
Gladstone Alley Project, Artifact Photographs,
selected artifacts labeled with associated test number
Comparing the Results with a Phase I Survey
Since the final report for the PCI Phase I archaeological survey included a full artifact inventory, along with photographs of selected artifacts, I simply applied the same rationale for artifact classification that I used for the original GAP artifact analysis to their 212 recovered historical period artifacts. The PCI collection strategy called for retaining primarily artifacts with obvious diagnostic traits, along with some efforts to record weights in the field for larger volumes of relatively non-diagnostic materials; whereas, the GAP study collected and analyzed mostly fragmentary artifacts that would generally be considered non-diagnostic in most prehistoric or early historical period archaeological projects. The artifacts recovered by both projects had some intriguing similarities, such as both recovering water spigots, one U.S. penny, and one .22 caliber shell casing.
|
Table 2. Categorized materials from Gladstone Alley | ||
|---|---|---|
|
|
Count Pct. |
Weight Pct. |
|
Bone |
4.109% |
1.177% |
|
Button |
0.057% |
0.014% |
|
Ceramic, Stoneware |
2.720% |
4.457% |
|
Ceramic, Other |
0.076% |
0.083% |
|
Construction Material |
3.690% |
6.840% |
|
Glass, Bottle |
37.227% |
30.321% |
|
Glass, Flat |
4.090% |
2.718% |
|
Glass, Other |
4.033% |
4.222% |
|
Metal, Construction |
22.028% |
23.849% |
|
Metal, Domestic Use |
1.008% |
1.637% |
|
Metal, Hardware |
0.342% |
4.687% |
|
Metal, Other |
19.079% |
17.621% |
|
Plastic |
0.704% |
0.212% |
|
Personal Items |
0.361% |
0.271% |
|
Porcelain |
0.418% |
1.205% |
|
Rubber |
0.038% |
0.681% |
|
Textile |
0.019% |
0.005% |
|
Total |
100.00% |
100.00% |
|
Domestic Aggregate |
45.06% |
37.59% |
|
Architectural Aggregate |
30.15% |
38.09% |
|
Architecture Ratio |
0.67 |
1.01 |
|
Table 3. Categorized materials from PCI Phase I | ||
|---|---|---|
|
|
Count Pct. |
Weight Pct. |
|
Bone |
16.038% |
2.035% |
|
Button |
0.472% |
0.049% |
|
Ceramic, Stoneware |
19.340% |
10.665% |
|
Ceramic, Other |
0.000% |
0.000% |
|
Construction Material |
4.717% |
5.230% |
|
Glass, Bottle |
37.264% |
53.921% |
|
Glass, Flat |
0.472% |
0.156% |
|
Glass, Other |
3.302% |
4.218% |
|
Metal, Construction |
8.019% |
3.182% |
|
Metal, Domestic Use |
0.000% |
0.000% |
|
Metal, Hardware |
0.943% |
15.698% |
|
Metal, Other |
3.774% |
3.215% |
|
Plastic |
0.943% |
0.160% |
|
Personal Items |
3.774% |
1.388% |
|
Porcelain |
0.943% |
0.082% |
|
Rubber |
0.000% |
0.000% |
|
Textile |
0.000% |
0.000% |
|
Total |
100.00% |
100.00% |
|
Domestic Aggregate |
72.64% |
66.62% |
|
Architectural Aggregate |
14.15% |
24.27% |
|
Architecture Ratio |
0.19 |
0.36 |
For additional details on the Results:
Results Chapter with Bibliography
Discussion
Overall, the method was successfully applied to this particular set of research problems; and, at this particular location, a much clearer picture of this site was obtained because of the intensive coverage of a small area. A few larger test units, excavated in the same area, might have, by chance, stumbled upon artifacts that confirmed a greater extent of the known temporal range for occupation, or that better revealed some aspect of daily life around Block 120; but, most of the known date range of occupation at the site was shown by bottle glass and by the “flow blue” ceramic sherd (although these items may have had curational value long after their period of manufacture), and the more recent end of the date range is certainly indicated by the 1981 Lincoln Penny. The method is well suited to this environment, where the expected density of artifacts is extremely high, and cultural material is very close to the surface; there is definitely a point of diminishing returns where the post hole diggers will no longer function in bringing up matrix and artifacts, but that point is deeper than was attempted at Gladstone Alley.
The method was tolerably consistent with regard to width (measured at ground surface) and depth of excavation, but for volume the standard deviation was almost half of mean (Table 1), although the exigencies of having to complete the project so that the team(s) could get back to closing down the USF field school led to a lot of lost information about internal depth of recovered materials. The primary influence on excavated width was hole deflection or loose sediment at the ground surface; once the hole was well defined at the surface, it generally stayed around that width at the surface. The primary influence on depth was hole refusal; the team(s) were able to reliably stop at the required depth when the contents of the hole allowed it. Volume was influenced by hole deflection and loose sediment at the ground surface, but was also subject to great variation in the angle of attack, both between excavators and over time for individual excavators. Thus, the idealized shape of a posthole would be better conceptualized as a barrel, rather than a true cylinder.
Artifact recovery is another hidden influence on hole volume. A test unit can easily intersect with large artifacts, or layers of unconsolidated materials (e.g., broken glass), or simply create large chunks of highly cemented construction materials from the downward force and impact of thrusting the posthole diggers into the ground. If posthole testing is being undertaken as a prelude to more intensive investigations, such as beginning a Phase II survey by determining where on the established site you might have the best chance of addressing the research conditions being addressed by the study, then that kind of volumetric inconsistency may not be an issue for the project as a whole. In this case, where it is actually the method being employed for subsurface sampling that is under evaluation, it was potentially more problematic. Specifically, it potentially created higher weight and/or count records for those test units that were significantly out of proportion with the ideal volume for an individual test unit.
As might be expected, the 10-foot interval seems to provide a more complete picture of artifact distribution (Quadrants II and IV producing generally less material that Quadrants where a 10-foot interval was used); and given the rapidity with which this method can be effected by even a single, well-prepared person functioning as digger, screener, and recorder, scissor-style posthole diggers do seem like an economical way to rapidly increase sampling intensity, for a limited area, with a generally high potential for encountering relevant artifacts and features. However, the actual field conditions of the GAP study area saw high incidents of hole refusal in the northern quadrants, mostly related to the subsurface archaeological remains of the Lincoln Theater. Moreover, in Quadrant IV, USF Unit #1 would have provided valuable additional data; unfortunately, there has, to my knowledge, never been any formal analysis, or reporting of specific results, for USF Units #1, #2, or #6. GAP test unit #1 did produce what is here being interpreted as moderately higher than expected domestic productivity; depending upon the research questions being addressed and overall nature of the site, that might be enough to justify placing a larger test unit in the general vicinity, especially since the quadrant did not produce a strong architectural result.
Conclusions
With regard to using manual, scissor-style posthole diggers as implements of archaeological subsurface sampling, I will neither advocate for their use, nor suggest that they are completely unsuitable to the task. With regular use, fieldworkers would build the muscle memory that would, in turn, increase consistency in sample size. At around eight inches in mean diameter, for projects with predetermined excavation depths less than four feet below ground surface, a posthole does allow for visual inspection of stratigraphy. If I were presented with the same field conditions and research design considerations today, then I would choose to excavate 20-centimeter square test units, with a T-handled Irish or border spade. Unfortunately, my reality as a professional archaeologist has been that regardless of what I would choose, the whole exercise will be supplanted by much lower density subsurface sampling with a bucket auger, supplemented by regular probing with a solid metal rod.
Access the complete revised report:
The Gladstone Alley Project: (Almost) Twenty Years Later (2022)
Additional Files:
Syllabus--2003 USF Field School
FDOT Report No. BC353-49 (A Model for Evaluating Archaeological Site Significance in Cities: A Case Study from Tampa, Florida)
Gladstone Alley Project--Master Artifact Data Sheet
Gladstone Alley Project--Artifact Catalog & Photographs
PCI Phase I Survey--Artifact Catalog
PCI Phase I Survey--Artifact Photographs
More About Central Avenue:
The work of the 2003 USF field school in urban archaeology was preceded by a multidisciplinary, multimedia study of African American life in Tampa, led by Dr. Susan D. Greenbaum and Dr. Cheryl R. Rodriguez, as the Central Avenue Legacies project. The results of this project were collected into eight articles for the Winter 1998 (Vol. 20, No. 1) issue of Practicing Anthropology.
Susan Greenbaum
Central Avenue Legacies: African American Heritage in Tampa, Florida
Cheryl R. Rodriguez
Recapturing Lost Images: Narratives of a Black Business Enclave
Geoff Mohlman
Dusty, but Useful, Data: Applied Anthropology and Archival Research
M. Yvette Baber
Urban Renewal Policy and Community Change
Hands-On History for Local Youth and University Students
Jennifer Paul
Central Avenue Legacies: A Walking Tour of Historic Black Tampa
Diane Turner
Black Music Traditions of Central Avenue
Ericka Burroughs
Robert Saunders and Civil Rights in Tampa
Otis R. Anthony African Americans in Florida Oral History Project.
The Central Avenue Legacies project received a collection of oral histories from community activist Otis R. Anthony. The recordings were mostly made in 1977 and 1978; however, the collection remains open to accepting new materials.
Recent Research
Travis R. Bell
Documenting an Imperfect Past: Examining Tampa's Racial Integration through Community, Film, and Remembrance of Central Avenue (2017)
More West Virginia Connections:
The Glenwood Project
You can learn more about antebellum African American history in Charleston, West Virginia, by perusing the various materials available from The Glenwood Project. This project, conducted in multiple phases, includes history, archaeology, and oral histories. However, their materials are not, overall, oriented toward African American history.
Negro Housing Survey of Charleston, July 1934
This report on African American housing conditions in Charleston, West Virginia was issued by the Bureau of Negro Welfare and Statistics, and includes charts, maps, and photographs.
Charleston had a district, known as "The Block," that was similar to Tampa's Central Avenue. There are a variety of resources that are available on this topic. This list is not exhaustive, but should provide some idea of the breadth of materials that are available.
Stan Bumgardner
Take a Walk around The Block (2019)
This recent article, from the Charleston Gazette-Mail, The article is a good overview of how urban renewal impacted "The Block." The article is currently hosted by My Hills, My Heritage, My Home; they maintain a page of resources relevant to African American history in West Virginia.
West Virginia Center for African-American Art & Culture
The West Virginia Center for African-American Art & Culture have been one of the primary drivers of ongoing research into "The Block". They have long hosted an excellent series of public lectures, and have an ongoing oral history project.
West Virginia Archives and History
West Virginia Archives and History have posted a series of YouTube videos of people providing personal accounts of life around the "The Block."
Historical Markers
Historical Marker--The Block
Historical Marker--The Block/Midland Trail
Additional Reading:
These references are older, but remain relevant to the study of African American history. This list is far from being an exhaustive suggested reading list; however, the references in this section are all available online.
A Study of Negro Life in Tampa
This study was conducted by Dr. Benjamin Elijah Mays, along with his wife, Sadie Gray Mays, the trained social worker. The Mays are probably best known for being civil rights activists; however, Dr. Mays also served as the sixth president of Morehouse College. The Mays were also paragons of conducting applied research, even serving on the board of the Tampa Urban League. The link above is the best low resolution copy available online, but the Florida Memory project hosts a full-color page-by-page scanned version of the final report. The color scans have the best quality photographs; most, if not all, of the original photographs are in the Jack Moore Collection, Special Collections, USF Libraries. The final report was published in 1927.
The Philadelphia Negro: A Social Study
This reference was originally published in 1899 as the final report of a study undertaken by W.E.B. DuBois, for the University of Pennsylvania. This link goes to the 1967 edition. DuBois conceptualized his study in four parts: the African American history of Philadelphia, the current conditions of the roughly 45,000 people included in the study as individuals, their condition as an organized social group, and as contextualized within their physical and social environment.
For additional details about archaeology at DuBois's boyhood home see:
An American Dilemma: The Negro Problem and Modern Democracy
This reference was issued as the final report of a study conducted by the Swedish economist Gunnar Myrdal, initiated at the behest of the Carnegie Corporation, in 1938. An American Dilemma was published in 1944.
Ideas for Educators:
Since I am currently practicing in West Virginia, I will primarily refer to the College and Career Readiness standards. The standards can be downloaded as PDFs, by subject area, for reference. In general, I will try to avoid making too many references to specific standards, except as an example. Individual educators will be in the best position to match the exact verbiage of a standard to their planned exercises.
For the K-8 grades, the standards for Geography and History will frequently be the most immediately suggested subject areas for writing lesson plans; however, with a little preparation time, Economics, and even Civics benchmarks might be included.
Sanborn Fire Insurance Maps
Sanborn fire insurance maps are an excellent educator resource for all grade levels. One of the best features of using fire insurance maps is that they are available for many cities and towns; there will likely be a map series for a location that is at somewhat familiar to the student. However, because the maps were designed to assess risk in fire insurance industry, they were designed to keep up with changes in building material and proximity to fire hazards. Thus, even for areas that are immediately familiar to the student, they may find them unrecognizable because things have changed extensively throughout history.
The Library of Congress hosts thousands of city sets that can be downloaded for free (use the Online Checklist for faster searches). The black and white versions are less freely available; there is a commercial source, but many public libraries have access through UMI Proquest (these can be used freely for non-commercial, educational purposes). With some additional preparation time, an image manipulation program (e.g., GIMP) can be used to remove the colors selectively. For those in West Virginia, the WVGISTC host some GeoTiff versions of the available color Sanborn maps, for use with GIS (e.g., QGIS).
The maps are drawn to scale, and generally good about communicating distance to nearest source of water for putting out fires. As a simple exercise, the black and white versions can be colored in by material (e.g., yellow for wood, red for brick, blue for stone/concrete, etc.), but they can also be used to address deeper issues about societal changes are shown by changes in neighborhoods, or how city expansion related to natural and cultural resources that were important to the city’s history. The changes can be disorienting, even for adults, so it is great to have historical photography, and supplemental materials like city directories, to help concretize it in people’s minds.
Additional Resources
Gentry, Melissa, Ball State University (2019)
Sanborn Fire Insurance Maps Tutorial.PDF
Lamb, Robert A., The California Geographer (1961)
The Sanborn Map: A Tool for the Geographer.PDF
Mueller, Lynne, The Primary Source (2004)
Sanborn Fire Insurance Maps: History, Use, Availability.PDF
Wright, Helena, IA. The Journal for the Society of Industrial Archaeology (1983)
Insurance Mapping and Industrial Archaeology
Wrigley, Robert L., Jr., Land Economics (1949)
The Sanborn Map as a Source of Land Use Information for City Planning.
|
Social Studies Specific Standards & Ideas | |
|---|---|
|
Standard(s) |
Idea(s) |
|
SS.1.10 |
Sanborn fire insurance maps are a primary document that can be used to investigate "ways communities change throughout history." They include map furniture like scale bars, legends, north compass roses, etc. Because the maps cover places where insurance companies had investments, some smaller towns were covered; you may not find a student's hometown, but you should be able to get close. |
|
SS.2.9 |
Sanborn fire insurance maps include many resources, not just commercial, industrial, and government buildings, but socially important buildings like schools and churches. There are many "real world" reasons to consult historic maps; the more positive reasons might include saving an historic building, but a negative reason might be tracking down the source of a chemical leaking from a long-forgotten tank. |
The research discussed in this article contains comparisons of area and volume, using relatively simple calculations of percentage increase and percentage decrease. As an illustrative example of real world math, those comparisons could be used with third grade students, but clearly matches specific standards in Ratios and Proportional Reasoning and Geometry.
|
Mathematics Specific Standards & Ideas | |
|---|---|
|
Standard(s) |
Idea(s) |
|
Grade 2 |
The Grade 2 standards emphasize two-dimensional areas and linear distances; however, students are also beginning to work with measuring and recording whole number distances (e.g., M.2.22), and dividing circles/squares into equal parts (e.g., M.2.25) as a prelude to working with fractions, etc. This article also give a "real world" example of counting in arrays of five by five (e.g., M.2.4), for example. One of the features that regularly occur on Sanborn maps (often in especially obvious ways on index sheets), as whole numbers, will be distance to water sources and/or firefighting stations; measurements could be made within or between towns, and the connection to time can be made in terms of fire response as a function of distance. |
|
Grade 4 |
The Grade 4 standards continue to build on the concepts of the previous grades, but this article uses a lot of concepts from standards M.4.16-20. |
|
Grade 6 |
The Grade 6 standards continue build on the concepts of the previous grades; however, the standards of the "Geometry" cluster, and those of the "Statistics and Probability" cluster, would go with the basic descriptive statistics in Table 1 from this article, and the sixth grade students will be prepared for the general comparison between volumes of cylinders, cubes, etc. |
Additional Links:
The Digital Archaeological Archive of Comparative Slavery
The African Diaspora Archaeology Network
The African American Burial Ground & Remembering Project
